| Param | Original file | Final file |
|---|---|---|
| Filename | modeM0/AS1A05_101T02_9000002680cztM0_level2_bc.evt | modeM0/AS1A05_101T02_9000002680cztM0_level2_quad_clean.evt |
| Size (bytes) | 814,285,440 | 270,711,360 |
| Size | 776.6 MB | 258.2 MB |
| Events in quadrant A | 4,012,374 | 1,734,204 |
| Events in quadrant B | 4,280,867 | 1,774,854 |
| Events in quadrant C | 3,995,419 | 1,721,991 |
| Events in quadrant D | 11,012,306 | 1,598,509 |
| Mode M0 | |||
|---|---|---|---|
| Quadrant | BADHDUFLAG | Total packets | Discarded packets |
| A | 0 | 40768 | 0 |
| B | 0 | 41395 | 0 |
| C | 0 | 40644 | 0 |
| D | 0 | 63504 | 0 |
| Mode M9 | |||
|---|---|---|---|
| Quadrant | BADHDUFLAG | Total packets | Discarded packets |
| A | 0 | 23 | 0 |
| B | 0 | 23 | 0 |
| C | 0 | 23 | 0 |
| D | 0 | 23 | 0 |
| Mode SS | |||
|---|---|---|---|
| Quadrant | BADHDUFLAG | Total packets | Discarded packets |
| A | 0 | 404 | 0 |
| B | 0 | 404 | 0 |
| C | 0 | 404 | 0 |
| D | 0 | 404 | 0 |
| Quadrant | Total seconds | Saturated seconds | Saturation percentage |
|---|---|---|---|
| A | 19883 | 132 | 0.663884% |
| B | 19883 | 183 | 0.920384% |
| C | 19883 | 211 | 1.061208% |
| D | 19883 | 1366 | 6.870191% |
Noise dominated data is calculated using 1-second bins in cleaned event files. If a bin has >2000 counts, and if more than 50% of those come from <1% of pixels, then it is considered to be noise-dominated and hence unusable.
| Quadrant | # 1 sec bins | Bins with >0 counts | Bins with >2000 counts | High rate bins dominated by noise | Noise dominated (total time) | Noise dominated (detector-on time) | Marked lightcurve |
|---|---|---|---|---|---|---|---|
| A | 22208 | 19884 | 5 | 5 | 0.02% | 0.03% | 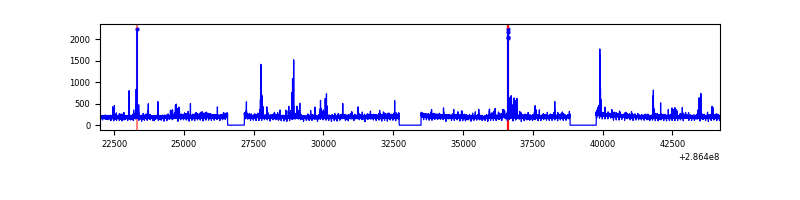 |
| B | 22208 | 19883 | 6 | 6 | 0.03% | 0.03% |  |
| C | 22208 | 19883 | 0 | 0 | 0.00% | 0.00% |  |
| D | 22208 | 19883 | 374 | 374 | 1.68% | 1.88% |  |
Top three noisy pixels from each quadrant. If the there are fewer than three noisy pixels in the level2.evt file, extra rows are filled as -1
| Pixel properties | Quadrant properties | ||||||
|---|---|---|---|---|---|---|---|
| Quadrant | DetID | PixID | Counts | Sigma | Mean | Median | Sigma |
| A | 4 | 2 | 100211 | 449.21 | 997 | 976 | 220.9 |
| A | 15 | 174 | 79131 | 353.79 | 997 | 976 | 220.9 |
| A | 12 | 194 | 6621 | 25.55 | 997 | 976 | 220.9 |
| B | 7 | 220 | 148892 | 748.68 | 1018 | 992 | 197.5 |
| B | 0 | 197 | 76382 | 381.63 | 1018 | 992 | 197.5 |
| B | 0 | 229 | 28716 | 140.34 | 1018 | 992 | 197.5 |
| C | 8 | 208 | 125979 | 530.85 | 975 | 964 | 235.5 |
| C | 3 | 233 | 91367 | 383.88 | 975 | 964 | 235.5 |
| C | 0 | 207 | 10169 | 39.09 | 975 | 964 | 235.5 |
| D | 7 | 238 | 4766589 | 21014.07 | 955 | 920 | 226.8 |
| D | 1 | 52 | 1103712 | 4862.73 | 955 | 920 | 226.8 |
| D | 11 | 176 | 751694 | 3310.52 | 955 | 920 | 226.8 |
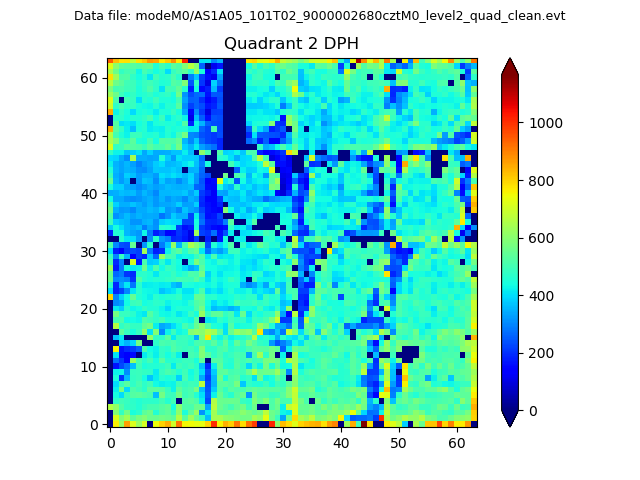
Histogram calculated using DETX and DETY for each event in the final _common_clean file
| Quadrant A |  |
 |
Quadrant B |
|---|---|---|---|
| Quadrant D | 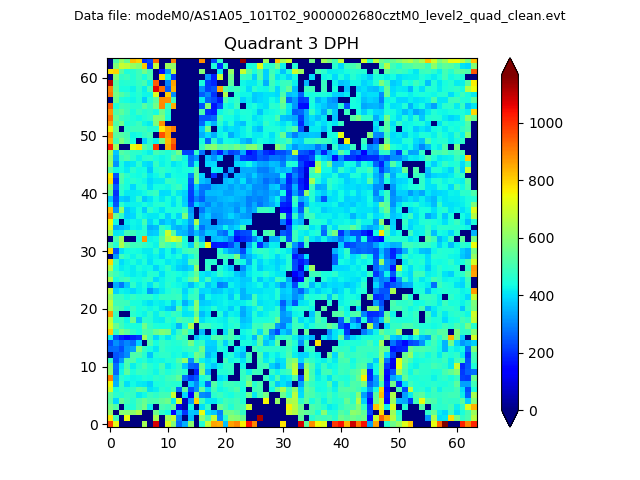 |
 |
Quadrant C |
| Plot type | Count rate plots | Images |
|---|---|---|
| Comparison with Poisson distribution Blue bars denote a histogram of data divided into 1 sec bins. Red curve is a Poisson curve with rate = median count rate of data. |
 |
 |
| Quadrant-wise count rates Data is divided into 100 sec bins |
 |
|
| Module-wise count rates for Quadrant A Data is divided into 100 sec bins |
 |
 |
| Module-wise count rates for Quadrant B Data is divided into 100 sec bins |
 |
 |
| Module-wise count rates for Quadrant C Data is divided into 100 sec bins |
 |
 |
| Module-wise count rates for Quadrant D Data is divided into 100 sec bins |
 |
 |
| Parameter | Plot |
|---|---|
| CZT HV Monitor |  |
| D_VDD |  |
| Temperature 1 |  |
| Veto HV Monitor | 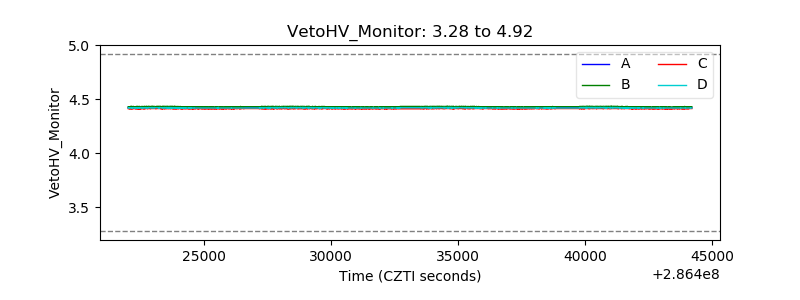 |
| Veto LLD |  |
| Alpha Counter |  |
| _CPM_Rate |  |
| CZT Counter |  |
| +2.5 Volts monitor | 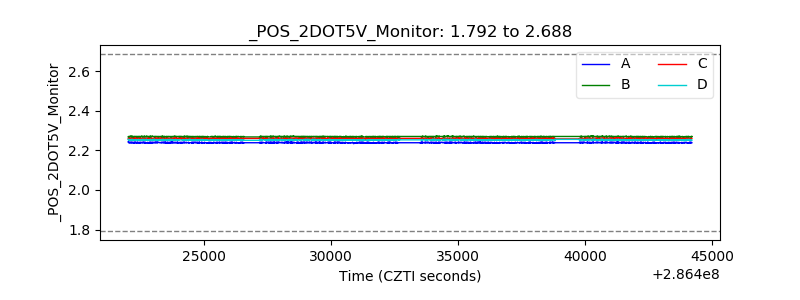 |
| +5 Volts monitor |  |
| _ROLL_ROT |  |
| _Roll_DEC |  |
| _Roll_RA |  |
| Veto Counter |  |