| Param | Original file | Final file |
|---|---|---|
| Filename | modeM0/AS1A05_165T07_9000002796cztM0_level2_bc.evt | modeM0/AS1A05_165T07_9000002796cztM0_level2_quad_clean.evt |
| Size (bytes) | 3,014,265,600 | 956,321,280 |
| Size | 2.8 GB | 912.0 MB |
| Events in quadrant A | 17,100,009 | 6,160,231 |
| Events in quadrant B | 17,425,275 | 6,267,225 |
| Events in quadrant C | 27,018,844 | 5,954,268 |
| Events in quadrant D | 24,964,598 | 5,769,461 |
| Mode M9 | |||
|---|---|---|---|
| Quadrant | BADHDUFLAG | Total packets | Discarded packets |
| A | 0 | 124 | 0 |
| B | 0 | 124 | 0 |
| C | 0 | 124 | 0 |
| D | 0 | 124 | 0 |
| Mode M0 | |||
|---|---|---|---|
| Quadrant | BADHDUFLAG | Total packets | Discarded packets |
| A | 0 | 160694 | 0 |
| B | 0 | 161326 | 0 |
| C | 0 | 208429 | 0 |
| D | 0 | 186129 | 0 |
| Mode SS | |||
|---|---|---|---|
| Quadrant | BADHDUFLAG | Total packets | Discarded packets |
| A | 0 | 765 | 0 |
| B | 0 | 765 | 0 |
| C | 0 | 765 | 0 |
| D | 0 | 765 | 0 |
| Quadrant | Total seconds | Saturated seconds | Saturation percentage |
|---|---|---|---|
| A | 75112 | 1001 | 1.332677% |
| B | 75112 | 964 | 1.283417% |
| C | 75112 | 1826 | 2.431036% |
| D | 75112 | 3495 | 4.653051% |
Noise dominated data is calculated using 1-second bins in cleaned event files. If a bin has >2000 counts, and if more than 50% of those come from <1% of pixels, then it is considered to be noise-dominated and hence unusable.
| Quadrant | # 1 sec bins | Bins with >0 counts | Bins with >2000 counts | High rate bins dominated by noise | Noise dominated (total time) | Noise dominated (detector-on time) | Marked lightcurve |
|---|---|---|---|---|---|---|---|
| A | 87682 | 75109 | 31 | 31 | 0.04% | 0.04% |  |
| B | 87682 | 75107 | 30 | 30 | 0.03% | 0.04% |  |
| C | 87682 | 75110 | 45 | 45 | 0.05% | 0.06% |  |
| D | 87682 | 75111 | 1861 | 1861 | 2.12% | 2.48% |  |
Top three noisy pixels from each quadrant. If the there are fewer than three noisy pixels in the level2.evt file, extra rows are filled as -1
| Pixel properties | Quadrant properties | ||||||
|---|---|---|---|---|---|---|---|
| Quadrant | DetID | PixID | Counts | Sigma | Mean | Median | Sigma |
| A | 0 | 13 | 767392 | 870.11 | 4052 | 3982 | 877.4 |
| A | 9 | 143 | 459180 | 518.82 | 4052 | 3982 | 877.4 |
| A | 13 | 254 | 106183 | 116.49 | 4052 | 3982 | 877.4 |
| B | 10 | 245 | 842126 | 1108.71 | 4094 | 4000 | 755.9 |
| B | 3 | 64 | 225343 | 292.8 | 4094 | 4000 | 755.9 |
| B | 4 | 216 | 159805 | 206.11 | 4094 | 4000 | 755.9 |
| C | 3 | 233 | 11781264 | 12934.11 | 3896 | 3883 | 910.6 |
| C | 0 | 207 | 235446 | 254.31 | 3896 | 3883 | 910.6 |
| C | 13 | 61 | 22525 | 20.47 | 3896 | 3883 | 910.6 |
| D | 1 | 52 | 7607381 | 8420.34 | 3934 | 3796 | 903.0 |
| D | 7 | 238 | 1702238 | 1880.88 | 3934 | 3796 | 903.0 |
| D | 2 | 234 | 314582 | 344.17 | 3934 | 3796 | 903.0 |
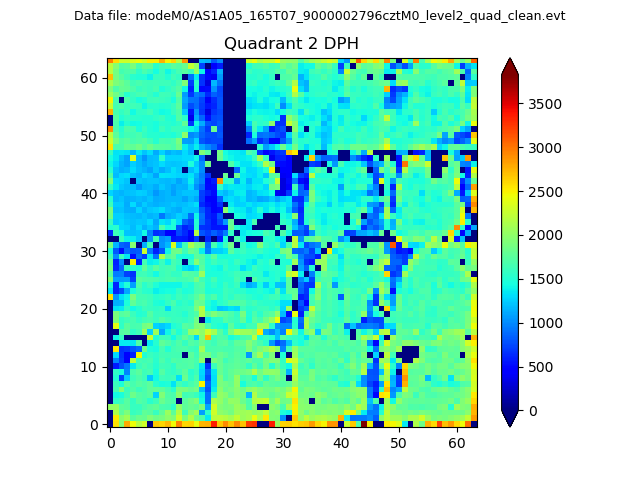
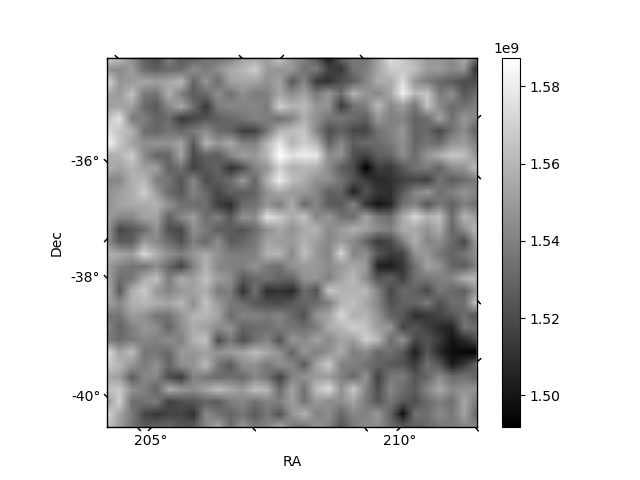
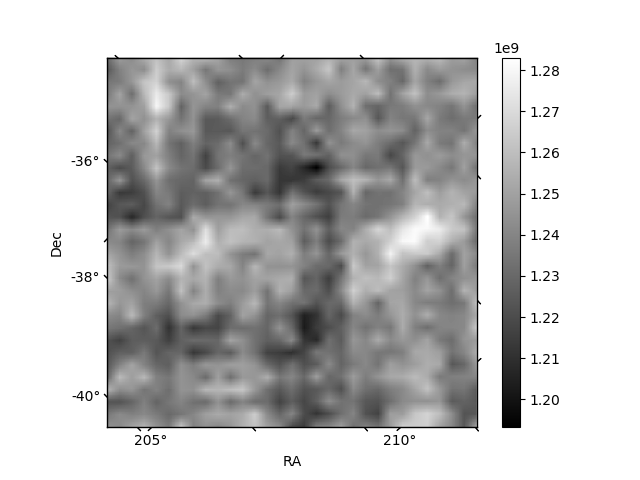
Histogram calculated using DETX and DETY for each event in the final _common_clean file
| Quadrant A | 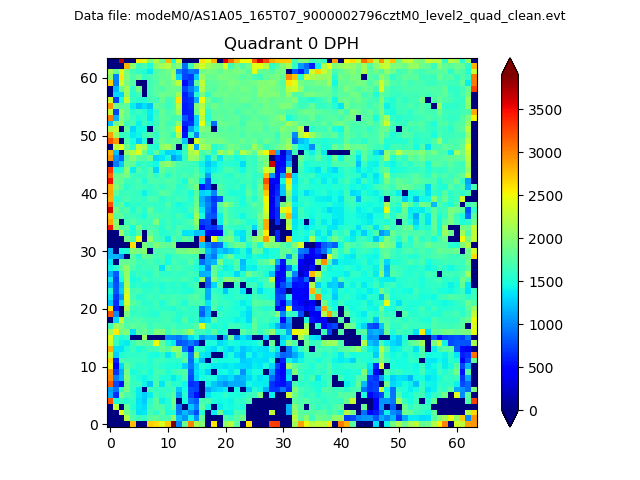 |
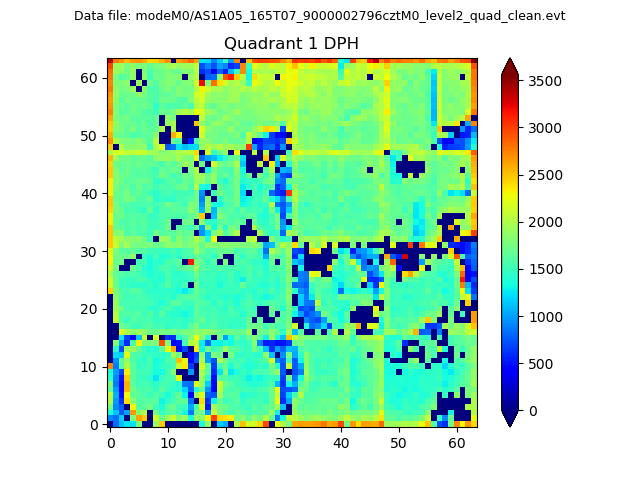 |
Quadrant B |
|---|---|---|---|
| Quadrant D | 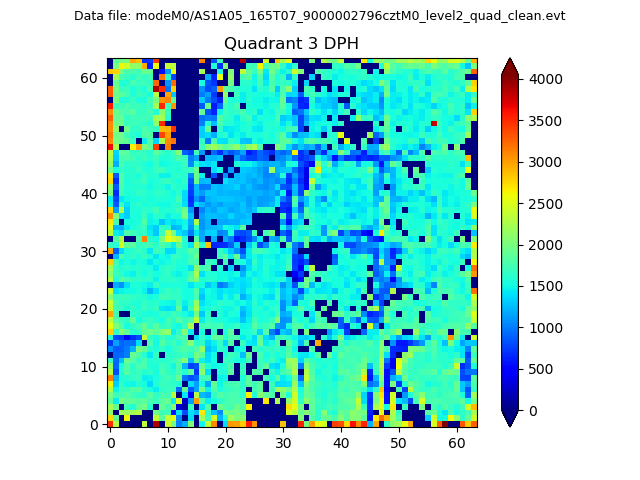 |
 |
Quadrant C |
| Plot type | Count rate plots | Images |
|---|---|---|
| Comparison with Poisson distribution Blue bars denote a histogram of data divided into 1 sec bins. Red curve is a Poisson curve with rate = median count rate of data. |
 |
 |
| Quadrant-wise count rates Data is divided into 100 sec bins |
 |
|
| Module-wise count rates for Quadrant A Data is divided into 100 sec bins |
 |
 |
| Module-wise count rates for Quadrant B Data is divided into 100 sec bins |
 |
 |
| Module-wise count rates for Quadrant C Data is divided into 100 sec bins |
 |
 |
| Module-wise count rates for Quadrant D Data is divided into 100 sec bins |
 |
 |
| Parameter | Plot |
|---|---|
| CZT HV Monitor |  |
| D_VDD | 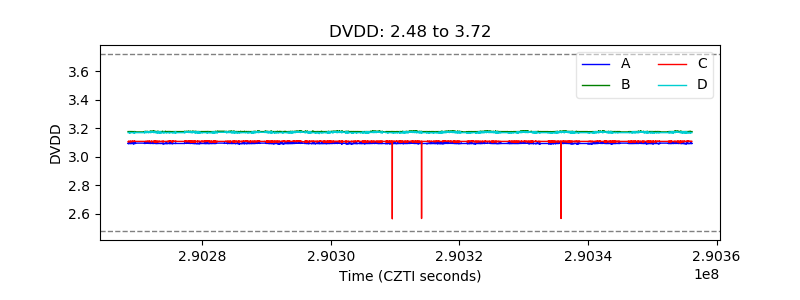 |
| Temperature 1 |  |
| Veto HV Monitor | 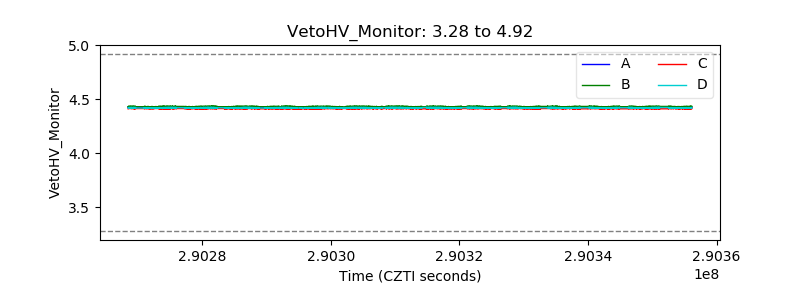 |
| Veto LLD |  |
| Alpha Counter |  |
| _CPM_Rate |  |
| CZT Counter | 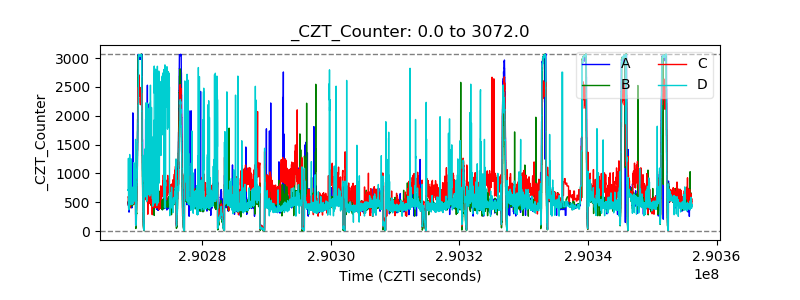 |
| +2.5 Volts monitor |  |
| +5 Volts monitor |  |
| _ROLL_ROT |  |
| _Roll_DEC |  |
| _Roll_RA |  |
| Veto Counter |  |