| Param | Original file | Final file |
|---|---|---|
| Filename | modeM0/AS1A05_025T18_9000003096cztM0_level2_bc.evt | modeM0/AS1A05_025T18_9000003096cztM0_level2_quad_clean.evt |
| Size (bytes) | 523,368,000 | 220,199,040 |
| Size | 499.1 MB | 210.0 MB |
| Events in quadrant A | 3,151,510 | 1,399,043 |
| Events in quadrant B | 3,722,328 | 1,417,284 |
| Events in quadrant C | 3,093,030 | 1,396,458 |
| Events in quadrant D | 4,770,526 | 1,338,458 |
| Mode M0 | |||
|---|---|---|---|
| Quadrant | BADHDUFLAG | Total packets | Discarded packets |
| A | 0 | 33214 | 0 |
| B | 0 | 34991 | 0 |
| C | 0 | 33280 | 0 |
| D | 0 | 37947 | 0 |
| Mode M9 | |||
|---|---|---|---|
| Quadrant | BADHDUFLAG | Total packets | Discarded packets |
| A | 0 | 12 | 0 |
| B | 0 | 13 | 0 |
| C | 0 | 13 | 0 |
| D | 0 | 13 | 0 |
| Mode SS | |||
|---|---|---|---|
| Quadrant | BADHDUFLAG | Total packets | Discarded packets |
| A | 0 | 328 | 0 |
| B | 0 | 328 | 0 |
| C | 0 | 328 | 0 |
| D | 0 | 328 | 0 |
| Quadrant | Total seconds | Saturated seconds | Saturation percentage |
|---|---|---|---|
| A | 16215 | 353 | 2.176997% |
| B | 16215 | 443 | 2.732038% |
| C | 16215 | 427 | 2.633364% |
| D | 16215 | 619 | 3.817453% |
Noise dominated data is calculated using 1-second bins in cleaned event files. If a bin has >2000 counts, and if more than 50% of those come from <1% of pixels, then it is considered to be noise-dominated and hence unusable.
| Quadrant | # 1 sec bins | Bins with >0 counts | Bins with >2000 counts | High rate bins dominated by noise | Noise dominated (total time) | Noise dominated (detector-on time) | Marked lightcurve |
|---|---|---|---|---|---|---|---|
| A | 16884 | 16215 | 0 | 0 | 0.00% | 0.00% |  |
| B | 16884 | 16214 | 1 | 1 | 0.01% | 0.01% | 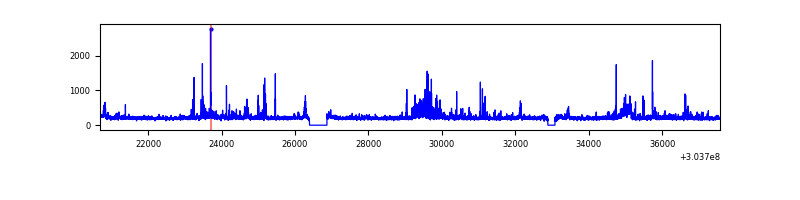 |
| C | 16885 | 16215 | 0 | 0 | 0.00% | 0.00% |  |
| D | 16884 | 16214 | 108 | 108 | 0.64% | 0.67% |  |
Top three noisy pixels from each quadrant. If the there are fewer than three noisy pixels in the level2.evt file, extra rows are filled as -1
| Pixel properties | Quadrant properties | ||||||
|---|---|---|---|---|---|---|---|
| Quadrant | DetID | PixID | Counts | Sigma | Mean | Median | Sigma |
| A | 13 | 254 | 6352 | 30.67 | 818 | 801 | 181.0 |
| A | 12 | 194 | 5261 | 24.64 | 818 | 801 | 181.0 |
| A | 0 | 226 | 5141 | 23.98 | 818 | 801 | 181.0 |
| B | 0 | 189 | 180456 | 1126.02 | 830 | 809 | 159.5 |
| B | 7 | 220 | 134353 | 837.05 | 830 | 809 | 159.5 |
| B | 0 | 229 | 64129 | 396.89 | 830 | 809 | 159.5 |
| C | 7 | 247 | 7880 | 37.13 | 799 | 793 | 190.9 |
| C | 8 | 128 | 4805 | 21.02 | 799 | 793 | 190.9 |
| C | 9 | 54 | 4747 | 20.72 | 799 | 793 | 190.9 |
| D | 1 | 20 | 454937 | 2438.67 | 804 | 777 | 186.2 |
| D | 1 | 52 | 360827 | 1933.34 | 804 | 777 | 186.2 |
| D | 13 | 174 | 332227 | 1779.77 | 804 | 777 | 186.2 |
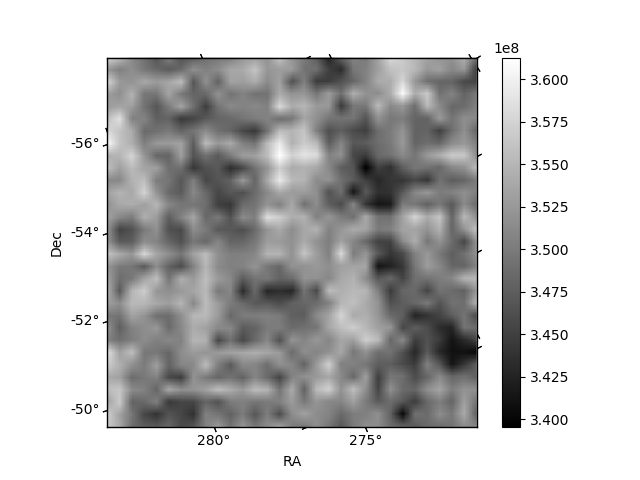
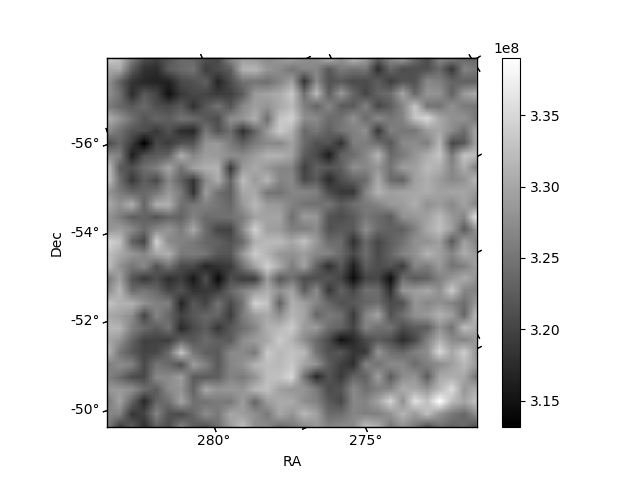
Histogram calculated using DETX and DETY for each event in the final _common_clean file
| Quadrant A | 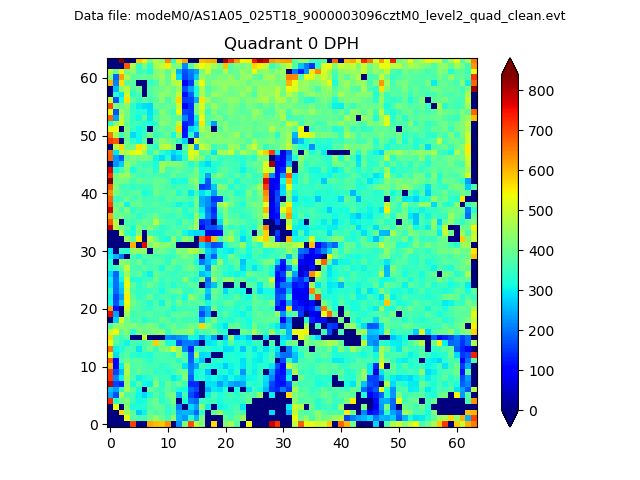 |
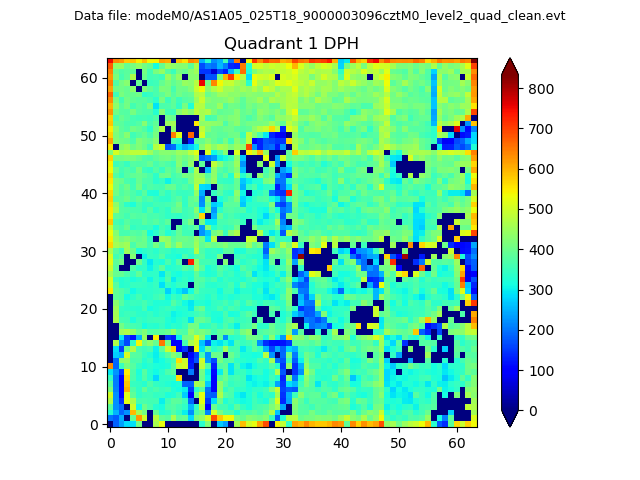 |
Quadrant B |
|---|---|---|---|
| Quadrant D | 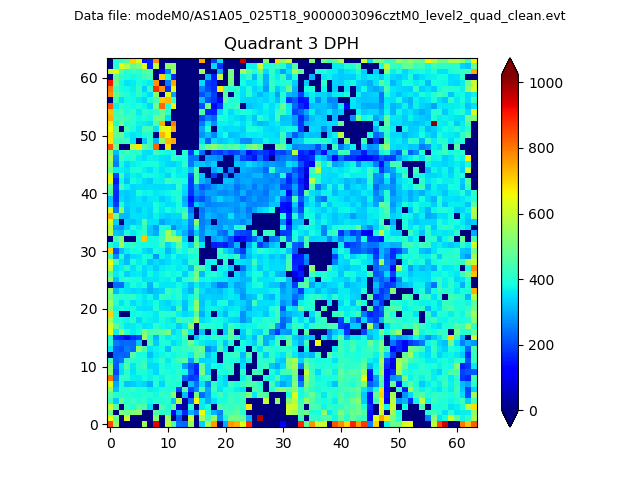 |
 |
Quadrant C |
| Plot type | Count rate plots | Images |
|---|---|---|
| Comparison with Poisson distribution Blue bars denote a histogram of data divided into 1 sec bins. Red curve is a Poisson curve with rate = median count rate of data. |
 |
 |
| Quadrant-wise count rates Data is divided into 100 sec bins |
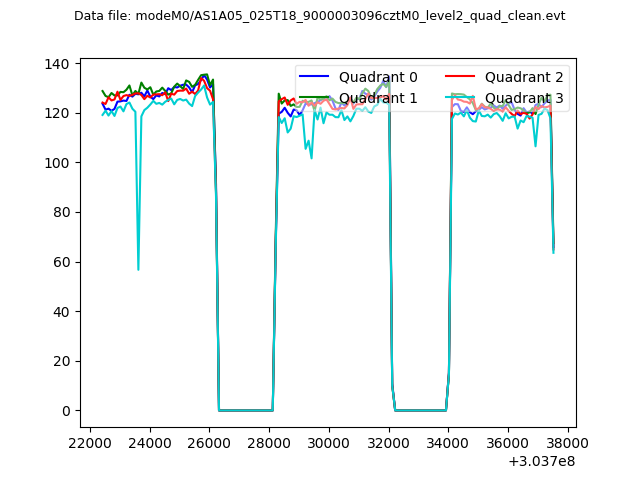 |
|
| Module-wise count rates for Quadrant A Data is divided into 100 sec bins |
 |
 |
| Module-wise count rates for Quadrant B Data is divided into 100 sec bins |
 |
 |
| Module-wise count rates for Quadrant C Data is divided into 100 sec bins |
 |
 |
| Module-wise count rates for Quadrant D Data is divided into 100 sec bins |
 |
 |
| Parameter | Plot |
|---|---|
| CZT HV Monitor |  |
| D_VDD | 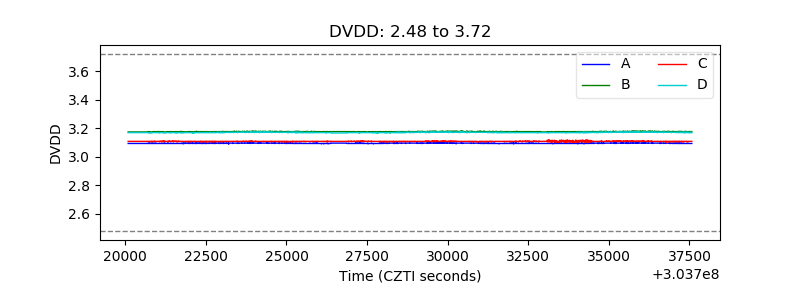 |
| Temperature 1 |  |
| Veto HV Monitor |  |
| Veto LLD |  |
| Alpha Counter |  |
| _CPM_Rate |  |
| CZT Counter |  |
| +2.5 Volts monitor |  |
| +5 Volts monitor |  |
| _ROLL_ROT | 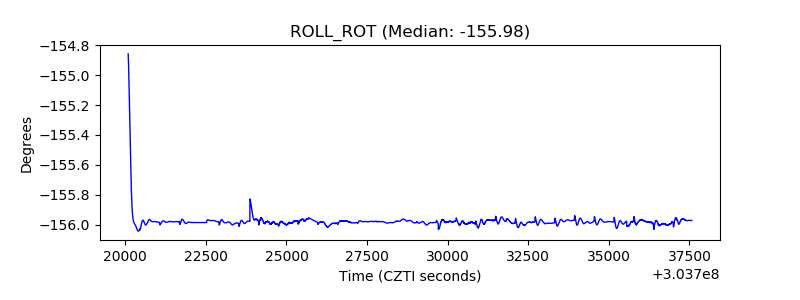 |
| _Roll_DEC | 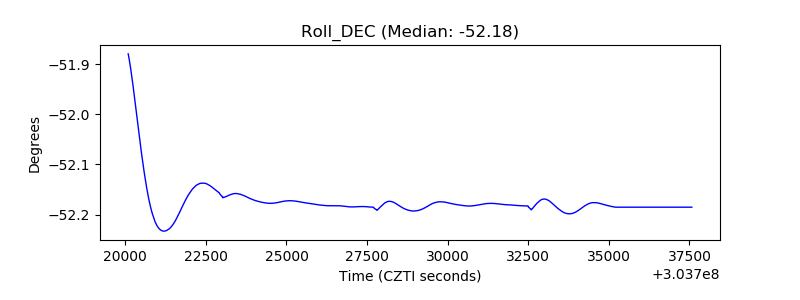 |
| _Roll_RA |  |
| Veto Counter |  |