| Param | Original file | Final file |
|---|---|---|
| Filename | modeM0/AS1C04_001T01_9000003126cztM0_level2_bc.evt | modeM0/AS1C04_001T01_9000003126cztM0_level2_quad_clean.evt |
| Size (bytes) | 3,459,340,800 | 1,421,017,920 |
| Size | 3.2 GB | 1.3 GB |
| Events in quadrant A | 16,966,127 | 9,782,775 |
| Events in quadrant B | 18,092,181 | 9,936,156 |
| Events in quadrant C | 15,245,795 | 9,633,871 |
| Events in quadrant D | 49,338,859 | 8,529,130 |
| Mode M9 | |||
|---|---|---|---|
| Quadrant | BADHDUFLAG | Total packets | Discarded packets |
| A | 0 | 121 | 0 |
| B | 0 | 121 | 0 |
| C | 0 | 121 | 0 |
| D | 0 | 121 | 0 |
| Mode M0 | |||
|---|---|---|---|
| Quadrant | BADHDUFLAG | Total packets | Discarded packets |
| A | 0 | 160519 | 0 |
| B | 0 | 162677 | 0 |
| C | 0 | 155943 | 0 |
| D | 0 | 281967 | 0 |
| Mode SS | |||
|---|---|---|---|
| Quadrant | BADHDUFLAG | Total packets | Discarded packets |
| A | 0 | 1532 | 0 |
| B | 0 | 1532 | 0 |
| C | 0 | 1532 | 0 |
| D | 0 | 1532 | 0 |
| Quadrant | Total seconds | Saturated seconds | Saturation percentage |
|---|---|---|---|
| A | 75261 | 1075 | 1.428363% |
| B | 75261 | 819 | 1.088213% |
| C | 75261 | 919 | 1.221084% |
| D | 75261 | 12241 | 16.264732% |
Noise dominated data is calculated using 1-second bins in cleaned event files. If a bin has >2000 counts, and if more than 50% of those come from <1% of pixels, then it is considered to be noise-dominated and hence unusable.
| Quadrant | # 1 sec bins | Bins with >0 counts | Bins with >2000 counts | High rate bins dominated by noise | Noise dominated (total time) | Noise dominated (detector-on time) | Marked lightcurve |
|---|---|---|---|---|---|---|---|
| A | 87356 | 75260 | 62 | 62 | 0.07% | 0.08% | 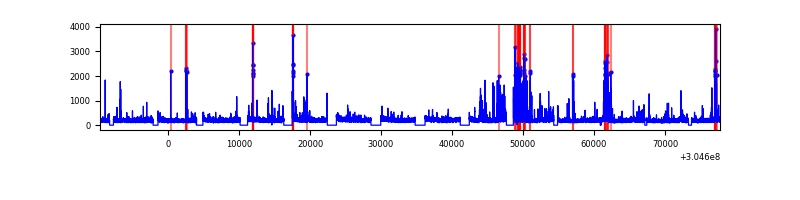 |
| B | 87356 | 75261 | 8 | 8 | 0.01% | 0.01% |  |
| C | 87356 | 75259 | 0 | 0 | 0.00% | 0.00% | 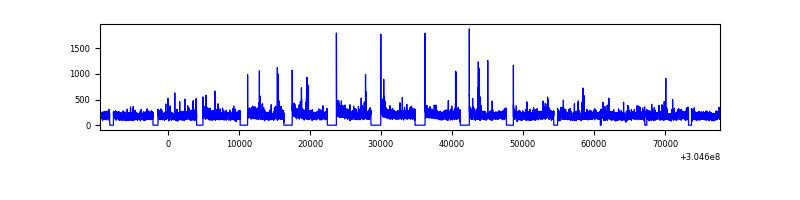 |
| D | 87356 | 75251 | 2821 | 2821 | 3.23% | 3.75% |  |
Top three noisy pixels from each quadrant. If the there are fewer than three noisy pixels in the level2.evt file, extra rows are filled as -1
| Pixel properties | Quadrant properties | ||||||
|---|---|---|---|---|---|---|---|
| Quadrant | DetID | PixID | Counts | Sigma | Mean | Median | Sigma |
| A | 5 | 16 | 1654942 | 1909.85 | 3936 | 3871 | 864.5 |
| A | 13 | 254 | 104413 | 116.3 | 3936 | 3871 | 864.5 |
| A | 8 | 6 | 36802 | 38.09 | 3936 | 3871 | 864.5 |
| B | 0 | 189 | 626560 | 831.83 | 3988 | 3898 | 748.5 |
| B | 0 | 229 | 324873 | 428.8 | 3988 | 3898 | 748.5 |
| B | 0 | 190 | 286267 | 377.23 | 3988 | 3898 | 748.5 |
| C | 3 | 233 | 296214 | 319.07 | 3842 | 3825 | 916.4 |
| C | 0 | 10 | 99805 | 104.74 | 3842 | 3825 | 916.4 |
| C | 13 | 61 | 22287 | 20.15 | 3842 | 3825 | 916.4 |
| D | 1 | 239 | 15713909 | 18647.26 | 3605 | 3489 | 842.5 |
| D | 1 | 20 | 9684274 | 11490.47 | 3605 | 3489 | 842.5 |
| D | 1 | 52 | 3617353 | 4289.43 | 3605 | 3489 | 842.5 |
Histogram calculated using DETX and DETY for each event in the final _common_clean file
| Quadrant A | 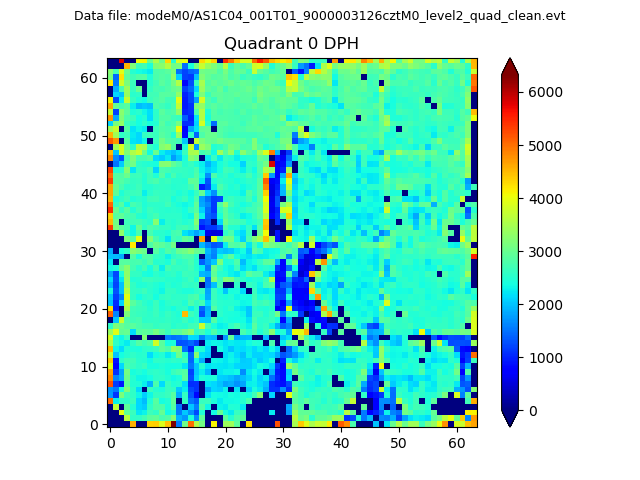 |
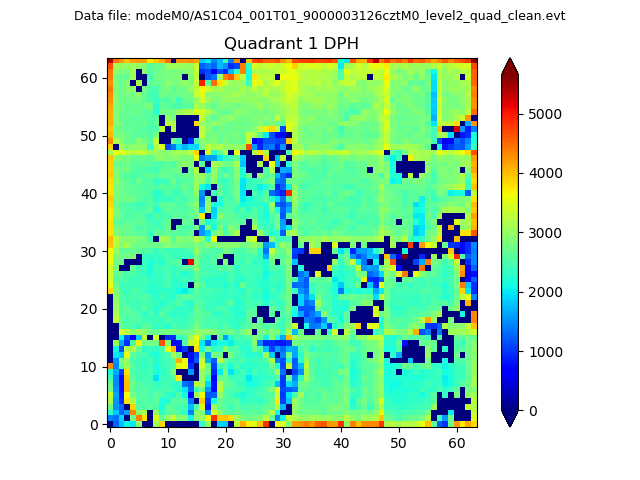 |
Quadrant B |
|---|---|---|---|
| Quadrant D | 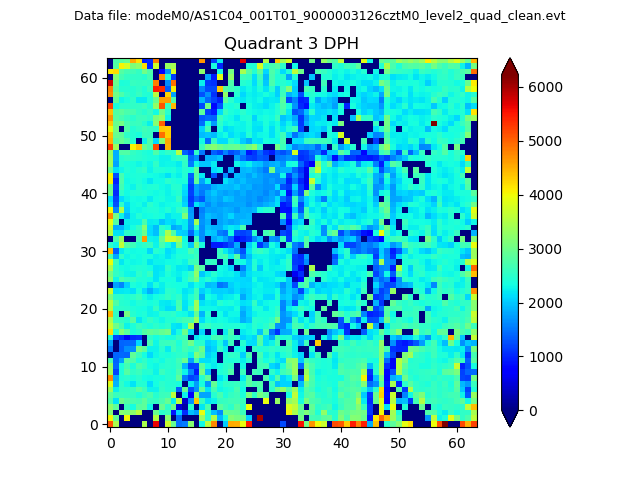 |
 |
Quadrant C |
| Plot type | Count rate plots | Images |
|---|---|---|
| Comparison with Poisson distribution Blue bars denote a histogram of data divided into 1 sec bins. Red curve is a Poisson curve with rate = median count rate of data. |
 |
 |
| Quadrant-wise count rates Data is divided into 100 sec bins |
 |
|
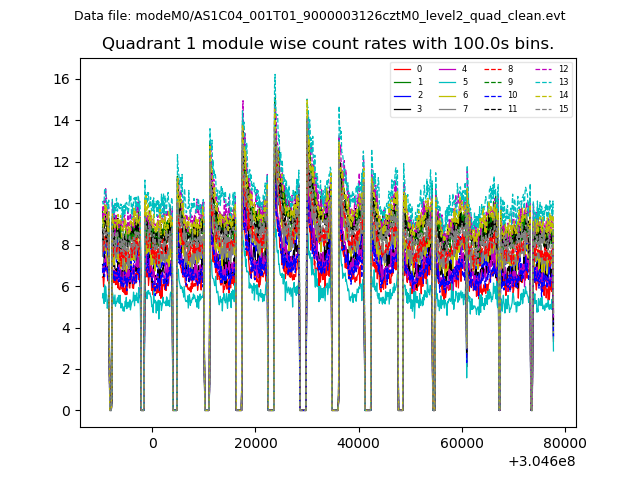
| Module-wise count rates for Quadrant A Data is divided into 100 sec bins |
 |
 |
| Module-wise count rates for Quadrant B Data is divided into 100 sec bins |
 |
 |
| Module-wise count rates for Quadrant C Data is divided into 100 sec bins |
 |
 |
| Module-wise count rates for Quadrant D Data is divided into 100 sec bins |
 |
 |
| Parameter | Plot |
|---|---|
| CZT HV Monitor |  |
| D_VDD | 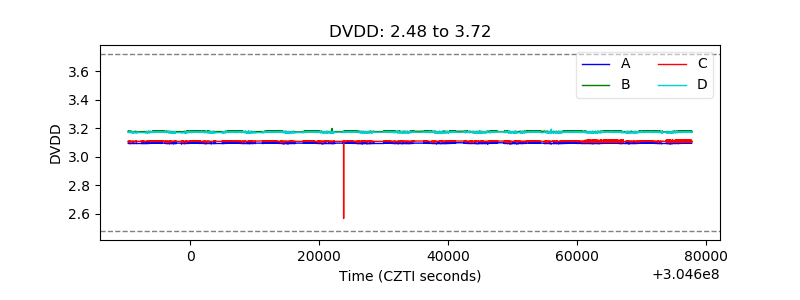 |
| Temperature 1 | 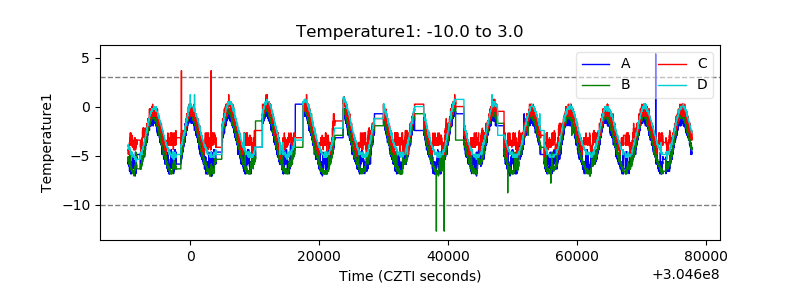 |
| Veto HV Monitor |  |
| Veto LLD |  |
| Alpha Counter |  |
| _CPM_Rate |  |
| CZT Counter |  |
| +2.5 Volts monitor |  |
| +5 Volts monitor |  |
| _ROLL_ROT |  |
| _Roll_DEC |  |
| _Roll_RA |  |
| Veto Counter | 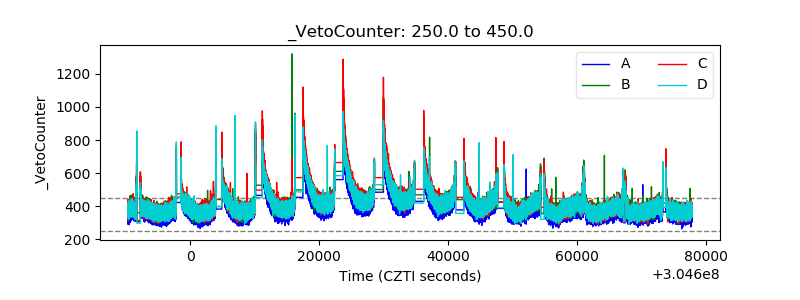 |