| Param | Original file | Final file |
|---|---|---|
| Filename | modeM0/AS1A05_041T01_9000003150cztM0_level2_bc.evt | modeM0/AS1A05_041T01_9000003150cztM0_level2_quad_clean.evt |
| Size (bytes) | 3,138,750,720 | 969,707,520 |
| Size | 2.9 GB | 924.8 MB |
| Events in quadrant A | 17,073,776 | 6,233,178 |
| Events in quadrant B | 16,839,257 | 6,306,578 |
| Events in quadrant C | 22,071,247 | 6,010,229 |
| Events in quadrant D | 34,003,242 | 5,715,397 |
| Mode SS | |||
|---|---|---|---|
| Quadrant | BADHDUFLAG | Total packets | Discarded packets |
| A | 0 | 1518 | 0 |
| B | 0 | 1514 | 0 |
| C | 0 | 1512 | 0 |
| D | 0 | 1512 | 0 |
| Mode M0 | |||
|---|---|---|---|
| Quadrant | BADHDUFLAG | Total packets | Discarded packets |
| A | 0 | 158613 | 0 |
| B | 0 | 159862 | 0 |
| C | 0 | 180129 | 0 |
| D | 0 | 228250 | 0 |
| Mode M9 | |||
|---|---|---|---|
| Quadrant | BADHDUFLAG | Total packets | Discarded packets |
| A | 0 | 125 | 0 |
| B | 0 | 125 | 0 |
| C | 0 | 124 | 0 |
| D | 0 | 124 | 0 |
| Quadrant | Total seconds | Saturated seconds | Saturation percentage |
|---|---|---|---|
| A | 74475 | 817 | 1.097012% |
| B | 74470 | 1177 | 1.580502% |
| C | 74455 | 2293 | 3.079713% |
| D | 74415 | 6693 | 8.994154% |
Noise dominated data is calculated using 1-second bins in cleaned event files. If a bin has >2000 counts, and if more than 50% of those come from <1% of pixels, then it is considered to be noise-dominated and hence unusable.
| Quadrant | # 1 sec bins | Bins with >0 counts | Bins with >2000 counts | High rate bins dominated by noise | Noise dominated (total time) | Noise dominated (detector-on time) | Marked lightcurve |
|---|---|---|---|---|---|---|---|
| A | 87418 | 74819 | 0 | 0 | 0.00% | 0.00% | 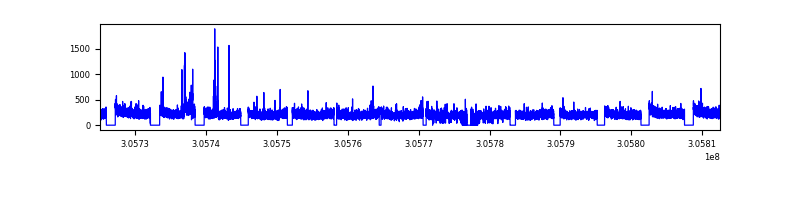 |
| B | 87418 | 74804 | 30 | 30 | 0.03% | 0.04% | 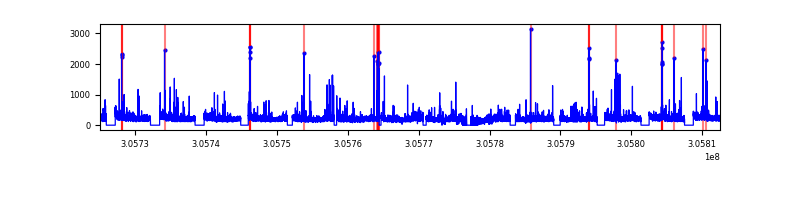 |
| C | 87418 | 74808 | 63 | 63 | 0.07% | 0.08% |  |
| D | 87418 | 74777 | 383 | 383 | 0.44% | 0.51% |  |
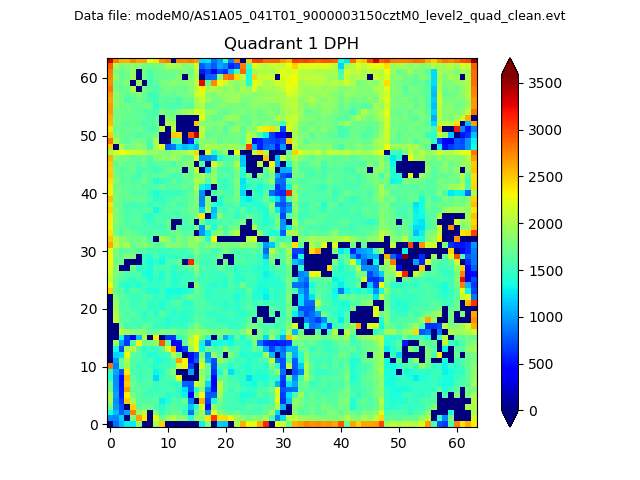
Top three noisy pixels from each quadrant. If the there are fewer than three noisy pixels in the level2.evt file, extra rows are filled as -1
| Pixel properties | Quadrant properties | ||||||
|---|---|---|---|---|---|---|---|
| Quadrant | DetID | PixID | Counts | Sigma | Mean | Median | Sigma |
| A | 5 | 168 | 861351 | 979.29 | 4080 | 4007 | 875.5 |
| A | 9 | 143 | 347110 | 391.91 | 4080 | 4007 | 875.5 |
| A | 11 | 47 | 96417 | 105.55 | 4080 | 4007 | 875.5 |
| B | 3 | 64 | 400202 | 518.77 | 4091 | 3991 | 763.7 |
| B | 0 | 230 | 367727 | 476.25 | 4091 | 3991 | 763.7 |
| B | 0 | 197 | 320681 | 414.65 | 4091 | 3991 | 763.7 |
| C | 3 | 233 | 6811274 | 7501.72 | 3899 | 3880 | 907.4 |
| C | 10 | 23 | 162752 | 175.08 | 3899 | 3880 | 907.4 |
| C | 10 | 91 | 94525 | 99.89 | 3899 | 3880 | 907.4 |
| D | 13 | 174 | 8753633 | 9854.54 | 3906 | 3777 | 887.9 |
| D | 12 | 235 | 3845703 | 4326.98 | 3906 | 3777 | 887.9 |
| D | 1 | 52 | 2957845 | 3327.03 | 3906 | 3777 | 887.9 |
Histogram calculated using DETX and DETY for each event in the final _common_clean file
| Quadrant A | 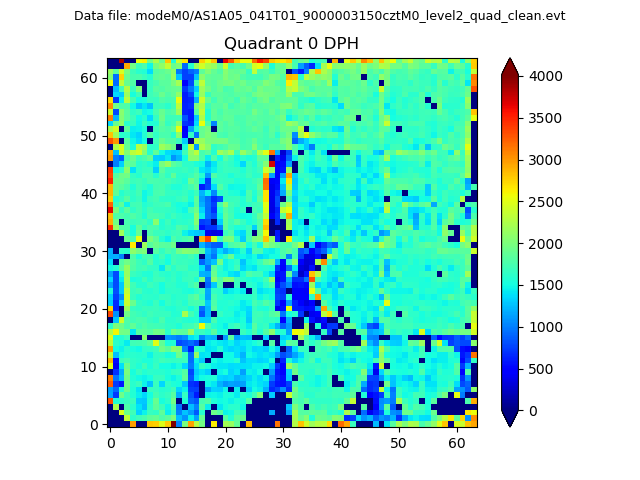 |
 |
Quadrant B |
|---|---|---|---|
| Quadrant D | 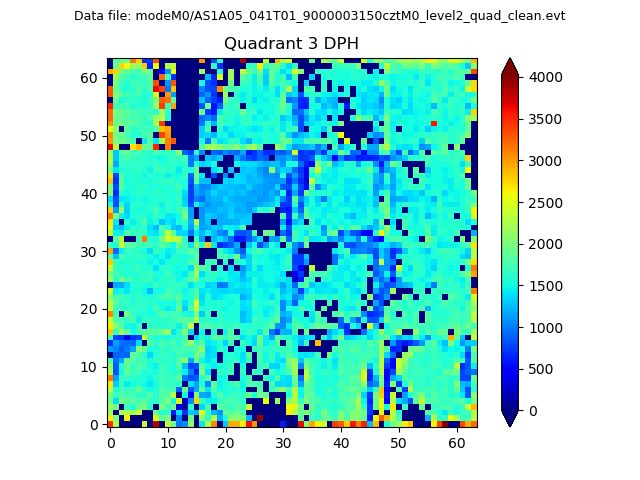 |
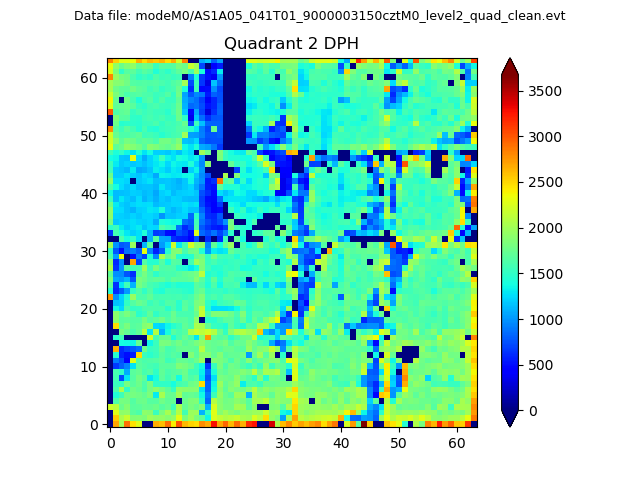 |
Quadrant C |
| Plot type | Count rate plots | Images |
|---|---|---|
| Comparison with Poisson distribution Blue bars denote a histogram of data divided into 1 sec bins. Red curve is a Poisson curve with rate = median count rate of data. |
 |
 |
| Quadrant-wise count rates Data is divided into 100 sec bins |
 |
|
| Module-wise count rates for Quadrant A Data is divided into 100 sec bins |
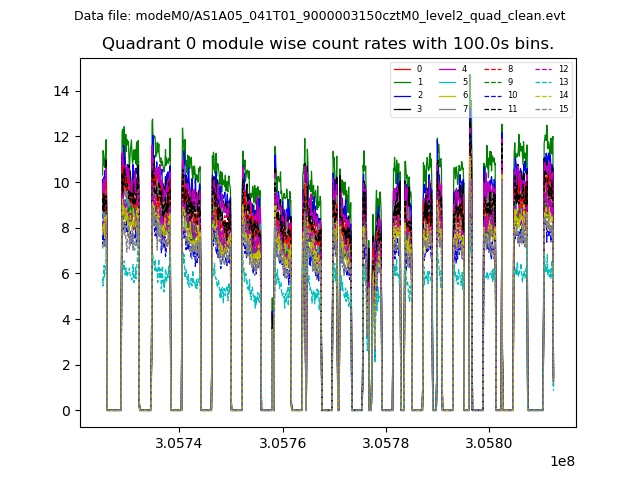 |
 |
| Module-wise count rates for Quadrant B Data is divided into 100 sec bins |
 |
 |
| Module-wise count rates for Quadrant C Data is divided into 100 sec bins |
 |
 |
| Module-wise count rates for Quadrant D Data is divided into 100 sec bins |
 |
 |
| Parameter | Plot |
|---|---|
| CZT HV Monitor |  |
| D_VDD | 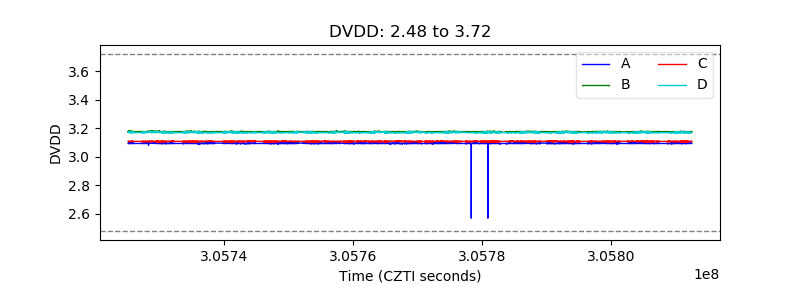 |
| Temperature 1 |  |
| Veto HV Monitor |  |
| Veto LLD | 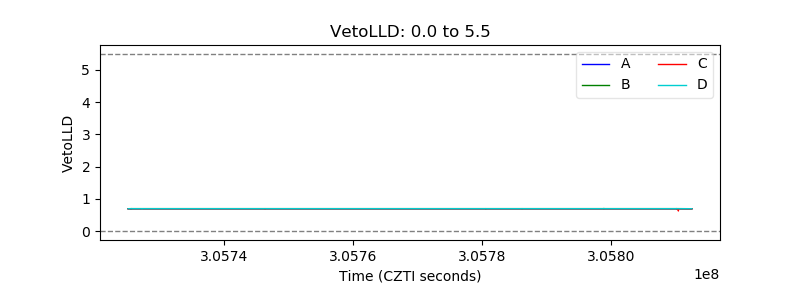 |
| Alpha Counter | 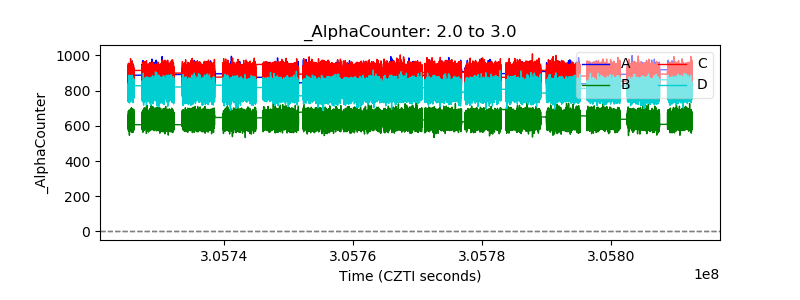 |
| _CPM_Rate |  |
| CZT Counter |  |
| +2.5 Volts monitor |  |
| +5 Volts monitor |  |
| _ROLL_ROT |  |
| _Roll_DEC |  |
| _Roll_RA | 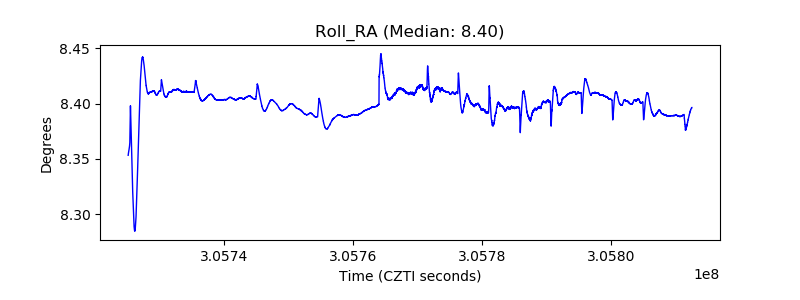 |
| Veto Counter | 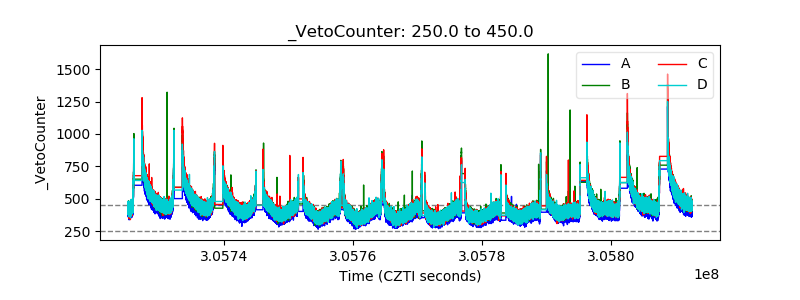 |