| Param | Original file | Final file |
|---|---|---|
| Filename | modeM0/AS1A07_153T02_9000003250cztM0_level2_bc.evt | modeM0/AS1A07_153T02_9000003250cztM0_level2_quad_clean.evt |
| Size (bytes) | 4,091,690,880 | 1,426,608,000 |
| Size | 3.8 GB | 1.3 GB |
| Events in quadrant A | 23,400,919 | 9,319,852 |
| Events in quadrant B | 25,362,033 | 9,433,461 |
| Events in quadrant C | 22,020,095 | 8,895,286 |
| Events in quadrant D | 46,123,681 | 8,504,537 |
| Mode SS | |||
|---|---|---|---|
| Quadrant | BADHDUFLAG | Total packets | Discarded packets |
| A | 0 | 2102 | 0 |
| B | 0 | 2102 | 0 |
| C | 0 | 2102 | 0 |
| D | 0 | 2102 | 0 |
| Mode M0 | |||
|---|---|---|---|
| Quadrant | BADHDUFLAG | Total packets | Discarded packets |
| A | 0 | 219146 | 0 |
| B | 0 | 226452 | 0 |
| C | 0 | 218006 | 0 |
| D | 0 | 301542 | 0 |
| Mode M9 | |||
|---|---|---|---|
| Quadrant | BADHDUFLAG | Total packets | Discarded packets |
| A | 0 | 196 | 0 |
| B | 0 | 196 | 0 |
| C | 0 | 196 | 0 |
| D | 0 | 196 | 0 |
| Quadrant | Total seconds | Saturated seconds | Saturation percentage |
|---|---|---|---|
| A | 102985 | 1255 | 1.218624% |
| B | 102985 | 1847 | 1.793465% |
| C | 102985 | 1884 | 1.829393% |
| D | 102985 | 6790 | 6.593193% |
Noise dominated data is calculated using 1-second bins in cleaned event files. If a bin has >2000 counts, and if more than 50% of those come from <1% of pixels, then it is considered to be noise-dominated and hence unusable.
| Quadrant | # 1 sec bins | Bins with >0 counts | Bins with >2000 counts | High rate bins dominated by noise | Noise dominated (total time) | Noise dominated (detector-on time) | Marked lightcurve |
|---|---|---|---|---|---|---|---|
| A | 122545 | 102975 | 2 | 2 | 0.00% | 0.00% |  |
| B | 122545 | 102969 | 77 | 77 | 0.06% | 0.07% |  |
| C | 122545 | 102971 | 0 | 0 | 0.00% | 0.00% | 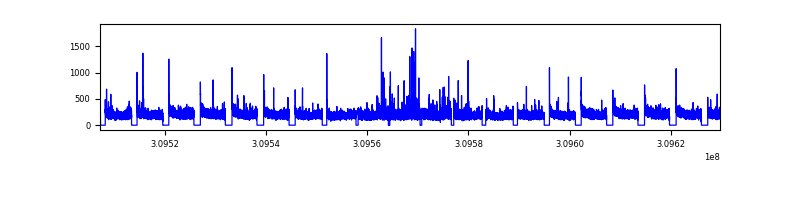 |
| D | 122545 | 102976 | 1570 | 1570 | 1.28% | 1.52% |  |
Top three noisy pixels from each quadrant. If the there are fewer than three noisy pixels in the level2.evt file, extra rows are filled as -1
| Pixel properties | Quadrant properties | ||||||
|---|---|---|---|---|---|---|---|
| Quadrant | DetID | PixID | Counts | Sigma | Mean | Median | Sigma |
| A | 15 | 236 | 416322 | 326.2 | 5914 | 5831 | 1258.4 |
| A | 13 | 254 | 167235 | 128.26 | 5914 | 5831 | 1258.4 |
| A | 3 | 1 | 133328 | 101.32 | 5914 | 5831 | 1258.4 |
| B | 3 | 64 | 1259005 | 1149.91 | 5941 | 5824 | 1089.8 |
| B | 0 | 230 | 551502 | 500.71 | 5941 | 5824 | 1089.8 |
| B | 0 | 190 | 214683 | 191.65 | 5941 | 5824 | 1089.8 |
| C | 0 | 239 | 160410 | 117.26 | 5641 | 5632 | 1319.9 |
| C | 0 | 10 | 106063 | 76.09 | 5641 | 5632 | 1319.9 |
| C | 9 | 54 | 49146 | 32.97 | 5641 | 5632 | 1319.9 |
| D | 7 | 238 | 13932600 | 10792.79 | 5651 | 5479 | 1290.4 |
| D | 1 | 52 | 7567557 | 5860.22 | 5651 | 5479 | 1290.4 |
| D | 11 | 176 | 950832 | 732.6 | 5651 | 5479 | 1290.4 |
Histogram calculated using DETX and DETY for each event in the final _common_clean file
| Quadrant A | 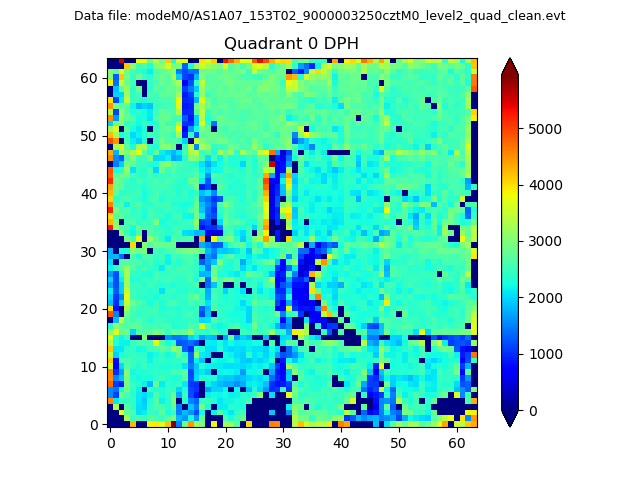 |
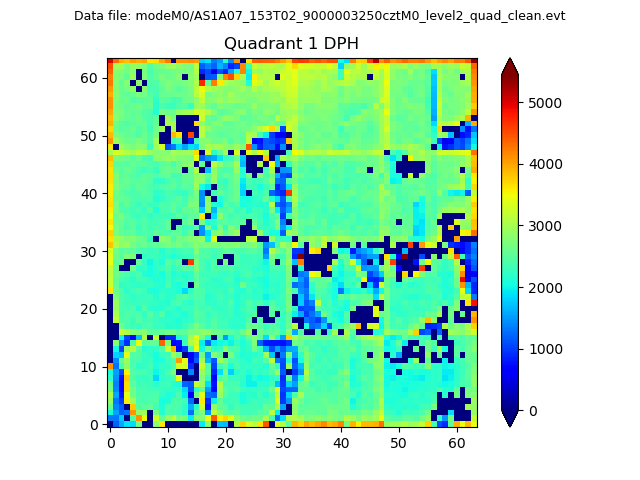 |
Quadrant B |
|---|---|---|---|
| Quadrant D | 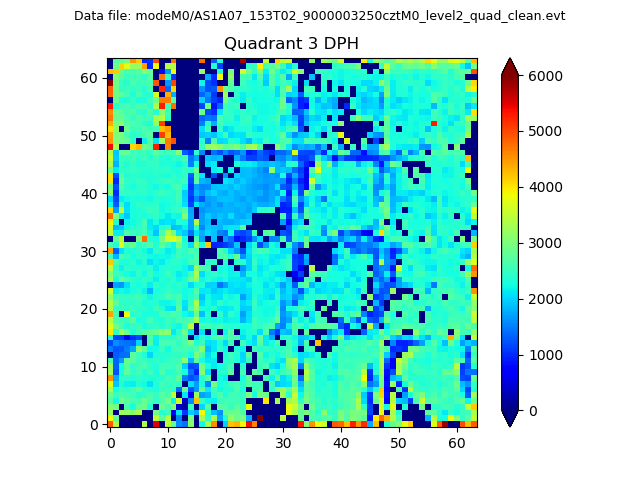 |
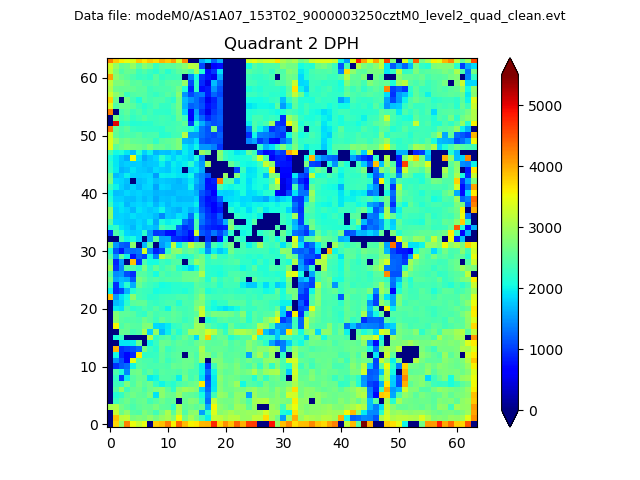 |
Quadrant C |
| Plot type | Count rate plots | Images |
|---|---|---|
| Comparison with Poisson distribution Blue bars denote a histogram of data divided into 1 sec bins. Red curve is a Poisson curve with rate = median count rate of data. |
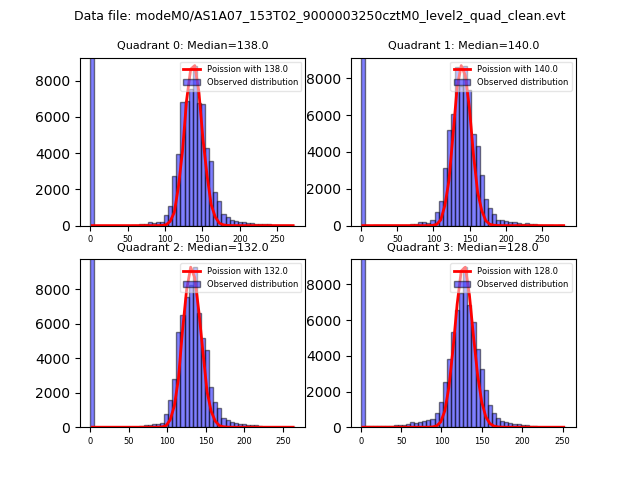 |
 |
| Quadrant-wise count rates Data is divided into 100 sec bins |
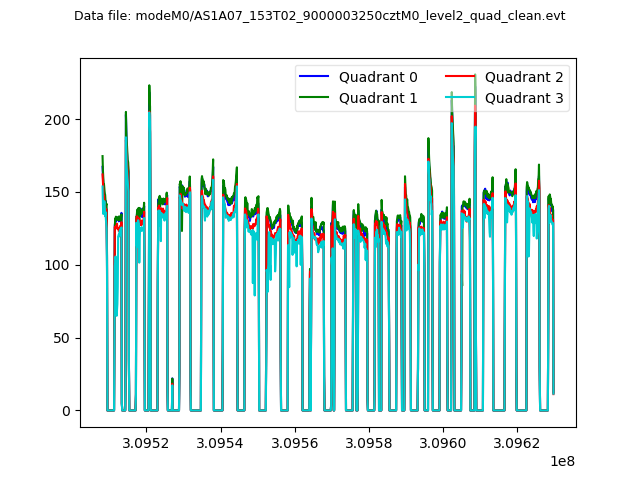 |
|
| Module-wise count rates for Quadrant A Data is divided into 100 sec bins |
 |
 |
| Module-wise count rates for Quadrant B Data is divided into 100 sec bins |
 |
 |
| Module-wise count rates for Quadrant C Data is divided into 100 sec bins |
 |
 |
| Module-wise count rates for Quadrant D Data is divided into 100 sec bins |
 |
 |
| Parameter | Plot |
|---|---|
| CZT HV Monitor | 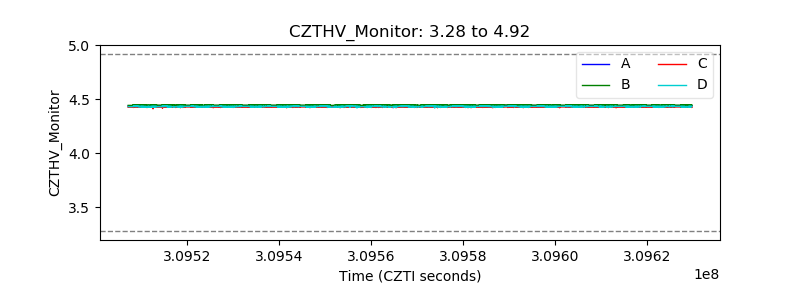 |
| D_VDD |  |
| Temperature 1 |  |
| Veto HV Monitor | 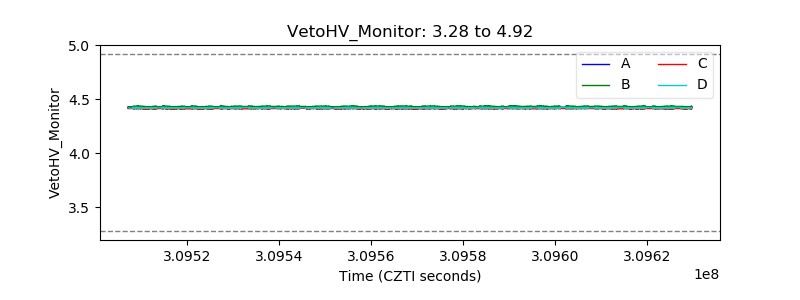 |
| Veto LLD | 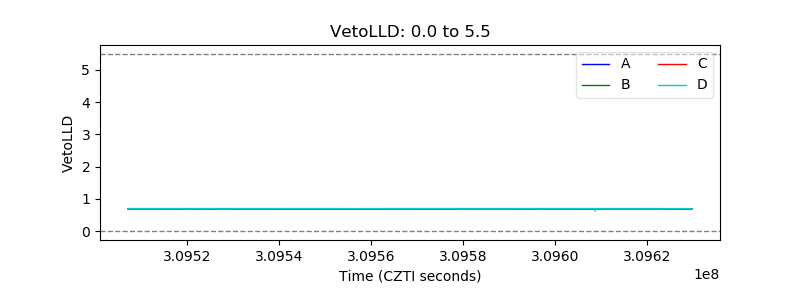 |
| Alpha Counter | 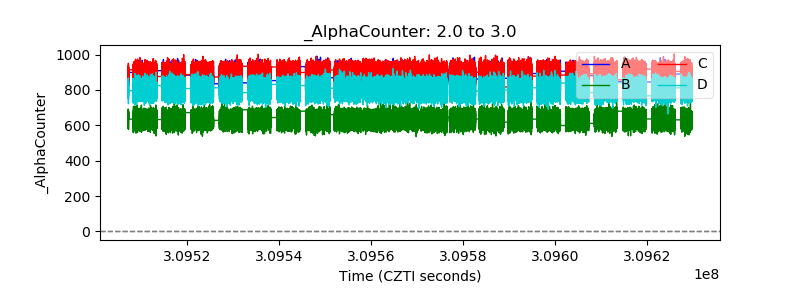 |
| _CPM_Rate |  |
| CZT Counter | 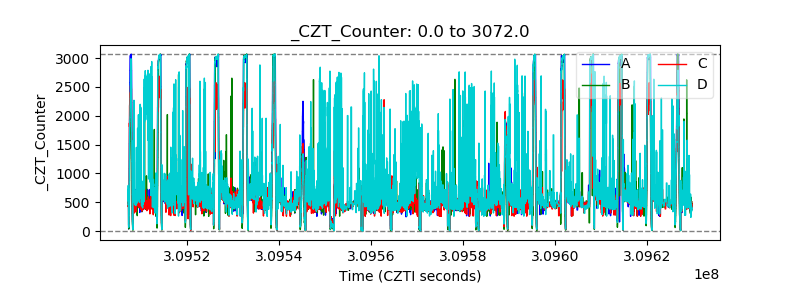 |
| +2.5 Volts monitor | 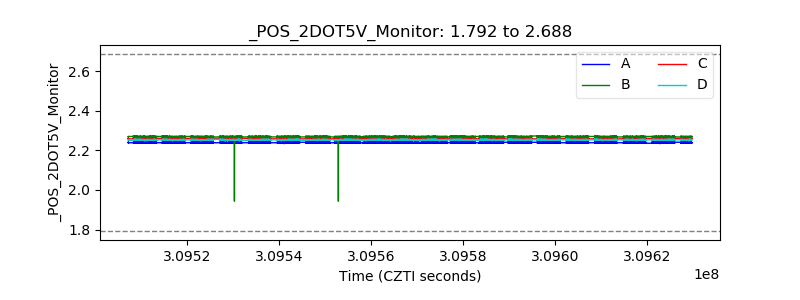 |
| +5 Volts monitor |  |
| _ROLL_ROT |  |
| _Roll_DEC | 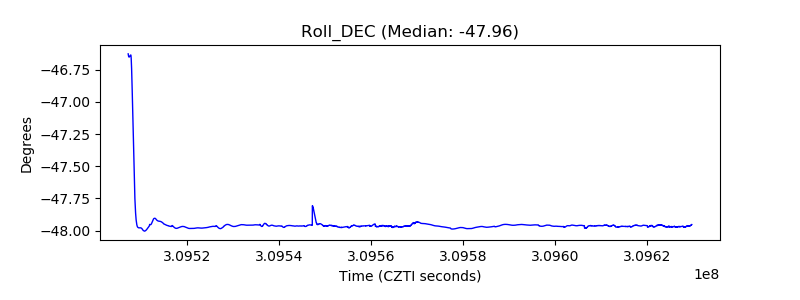 |
| _Roll_RA |  |
| Veto Counter |  |