| Param | Original file | Final file |
|---|---|---|
| Filename | modeM0/AS1A07_059T05_9000003252cztM0_level2_bc.evt | modeM0/AS1A07_059T05_9000003252cztM0_level2_quad_clean.evt |
| Size (bytes) | 1,416,003,840 | 438,710,400 |
| Size | 1.3 GB | 418.4 MB |
| Events in quadrant A | 7,265,752 | 2,805,831 |
| Events in quadrant B | 7,923,292 | 2,847,206 |
| Events in quadrant C | 7,215,605 | 2,712,159 |
| Events in quadrant D | 18,059,879 | 2,487,125 |
| Mode SS | |||
|---|---|---|---|
| Quadrant | BADHDUFLAG | Total packets | Discarded packets |
| A | 0 | 720 | 0 |
| B | 0 | 720 | 0 |
| C | 0 | 720 | 0 |
| D | 0 | 720 | 0 |
| Mode M0 | |||
|---|---|---|---|
| Quadrant | BADHDUFLAG | Total packets | Discarded packets |
| A | 0 | 73212 | 0 |
| B | 0 | 75413 | 0 |
| C | 0 | 74063 | 0 |
| D | 0 | 114299 | 0 |
| Mode M9 | |||
|---|---|---|---|
| Quadrant | BADHDUFLAG | Total packets | Discarded packets |
| A | 0 | 33 | 0 |
| B | 0 | 33 | 0 |
| C | 0 | 33 | 0 |
| D | 0 | 33 | 0 |
| Quadrant | Total seconds | Saturated seconds | Saturation percentage |
|---|---|---|---|
| A | 35445 | 273 | 0.770207% |
| B | 35445 | 446 | 1.258287% |
| C | 35445 | 572 | 1.613768% |
| D | 35445 | 3813 | 10.757512% |
Noise dominated data is calculated using 1-second bins in cleaned event files. If a bin has >2000 counts, and if more than 50% of those come from <1% of pixels, then it is considered to be noise-dominated and hence unusable.
| Quadrant | # 1 sec bins | Bins with >0 counts | Bins with >2000 counts | High rate bins dominated by noise | Noise dominated (total time) | Noise dominated (detector-on time) | Marked lightcurve |
|---|---|---|---|---|---|---|---|
| A | 38665 | 35446 | 0 | 0 | 0.00% | 0.00% |  |
| B | 38665 | 35440 | 13 | 13 | 0.03% | 0.04% |  |
| C | 38665 | 35443 | 42 | 42 | 0.11% | 0.12% |  |
| D | 38665 | 35444 | 1022 | 1022 | 2.64% | 2.88% |  |
Top three noisy pixels from each quadrant. If the there are fewer than three noisy pixels in the level2.evt file, extra rows are filled as -1
| Pixel properties | Quadrant properties | ||||||
|---|---|---|---|---|---|---|---|
| Quadrant | DetID | PixID | Counts | Sigma | Mean | Median | Sigma |
| A | 3 | 1 | 82193 | 201.04 | 1840 | 1806 | 399.9 |
| A | 13 | 254 | 60754 | 147.42 | 1840 | 1806 | 399.9 |
| A | 15 | 236 | 58803 | 142.54 | 1840 | 1806 | 399.9 |
| B | 3 | 64 | 376273 | 1062.57 | 1855 | 1812 | 352.4 |
| B | 0 | 230 | 130404 | 364.89 | 1855 | 1812 | 352.4 |
| B | 0 | 190 | 108408 | 302.48 | 1855 | 1812 | 352.4 |
| C | 10 | 22 | 285270 | 673.69 | 1771 | 1760 | 420.8 |
| C | 9 | 54 | 53588 | 123.16 | 1771 | 1760 | 420.8 |
| C | 8 | 128 | 23904 | 52.62 | 1771 | 1760 | 420.8 |
| D | 1 | 52 | 4746900 | 11645.38 | 1726 | 1661 | 407.5 |
| D | 5 | 222 | 3876708 | 9509.83 | 1726 | 1661 | 407.5 |
| D | 7 | 238 | 1085146 | 2659.0 | 1726 | 1661 | 407.5 |
Histogram calculated using DETX and DETY for each event in the final _common_clean file
| Quadrant A | 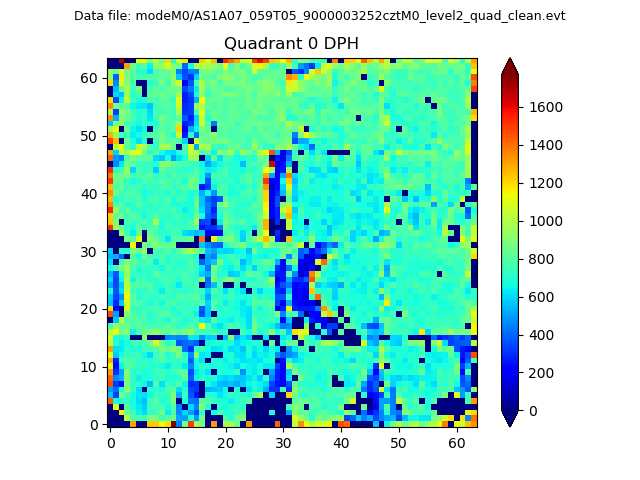 |
 |
Quadrant B |
|---|---|---|---|
| Quadrant D | 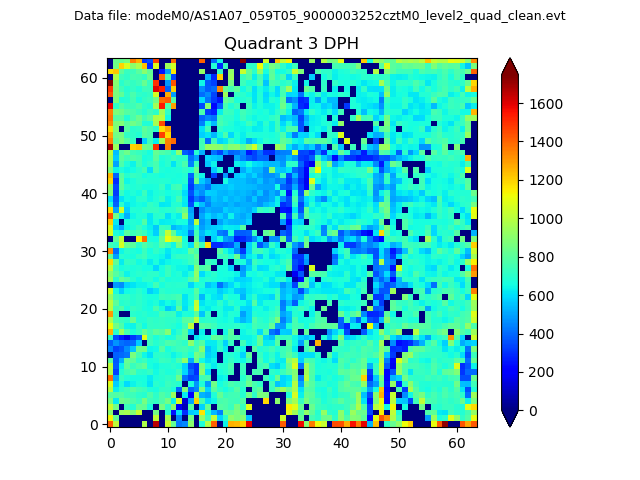 |
 |
Quadrant C |
| Plot type | Count rate plots | Images |
|---|---|---|
| Comparison with Poisson distribution Blue bars denote a histogram of data divided into 1 sec bins. Red curve is a Poisson curve with rate = median count rate of data. |
 |
 |
| Quadrant-wise count rates Data is divided into 100 sec bins |
 |
|
| Module-wise count rates for Quadrant A Data is divided into 100 sec bins |
 |
 |
| Module-wise count rates for Quadrant B Data is divided into 100 sec bins |
 |
 |
| Module-wise count rates for Quadrant C Data is divided into 100 sec bins |
 |
 |
| Module-wise count rates for Quadrant D Data is divided into 100 sec bins |
 |
 |
| Parameter | Plot |
|---|---|
| CZT HV Monitor |  |
| D_VDD |  |
| Temperature 1 |  |
| Veto HV Monitor |  |
| Veto LLD |  |
| Alpha Counter | 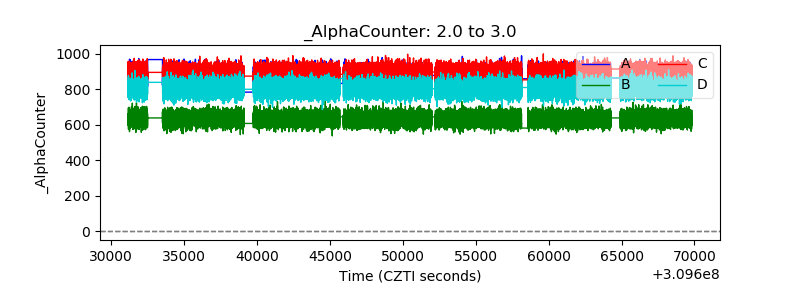 |
| _CPM_Rate |  |
| CZT Counter |  |
| +2.5 Volts monitor |  |
| +5 Volts monitor | 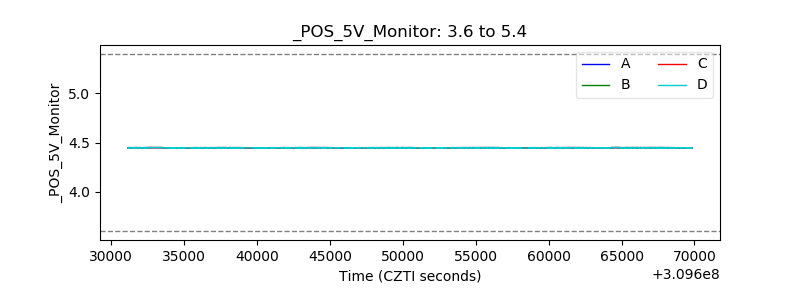 |
| _ROLL_ROT |  |
| _Roll_DEC |  |
| _Roll_RA | 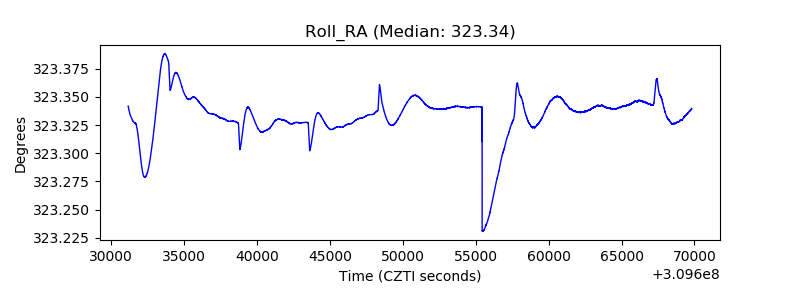 |
| Veto Counter |  |