| Param | Original file | Final file |
|---|---|---|
| Filename | modeM0/AS1A07_134T01_9000003256cztM0_level2_bc.evt | modeM0/AS1A07_134T01_9000003256cztM0_level2_quad_clean.evt |
| Size (bytes) | 2,218,991,040 | 679,106,880 |
| Size | 2.1 GB | 647.6 MB |
| Events in quadrant A | 11,340,575 | 4,321,036 |
| Events in quadrant B | 12,784,239 | 4,367,968 |
| Events in quadrant C | 10,987,529 | 4,190,052 |
| Events in quadrant D | 28,351,521 | 3,925,772 |
| Mode M9 | |||
|---|---|---|---|
| Quadrant | BADHDUFLAG | Total packets | Discarded packets |
| A | 0 | 73 | 0 |
| B | 0 | 73 | 0 |
| C | 0 | 73 | 0 |
| D | 0 | 73 | 0 |
| Mode SS | |||
|---|---|---|---|
| Quadrant | BADHDUFLAG | Total packets | Discarded packets |
| A | 0 | 1120 | 0 |
| B | 0 | 1120 | 0 |
| C | 0 | 1120 | 0 |
| D | 0 | 1120 | 0 |
| Mode M0 | |||
|---|---|---|---|
| Quadrant | BADHDUFLAG | Total packets | Discarded packets |
| A | 0 | 113524 | 0 |
| B | 0 | 118905 | 0 |
| C | 0 | 114219 | 0 |
| D | 0 | 171166 | 0 |
| Quadrant | Total seconds | Saturated seconds | Saturation percentage |
|---|---|---|---|
| A | 54863 | 372 | 0.678053% |
| B | 54863 | 784 | 1.429014% |
| C | 54863 | 683 | 1.244919% |
| D | 54863 | 4823 | 8.790988% |
Noise dominated data is calculated using 1-second bins in cleaned event files. If a bin has >2000 counts, and if more than 50% of those come from <1% of pixels, then it is considered to be noise-dominated and hence unusable.
| Quadrant | # 1 sec bins | Bins with >0 counts | Bins with >2000 counts | High rate bins dominated by noise | Noise dominated (total time) | Noise dominated (detector-on time) | Marked lightcurve |
|---|---|---|---|---|---|---|---|
| A | 62068 | 54858 | 0 | 0 | 0.00% | 0.00% | 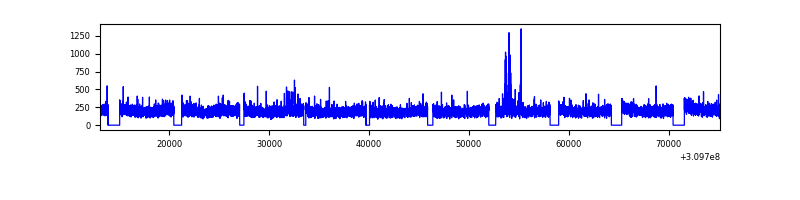 |
| B | 62068 | 54857 | 47 | 47 | 0.08% | 0.09% | 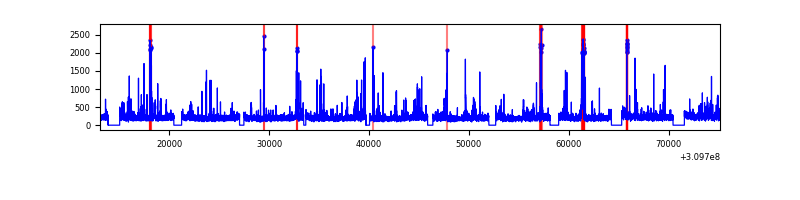 |
| C | 62068 | 54856 | 0 | 0 | 0.00% | 0.00% | 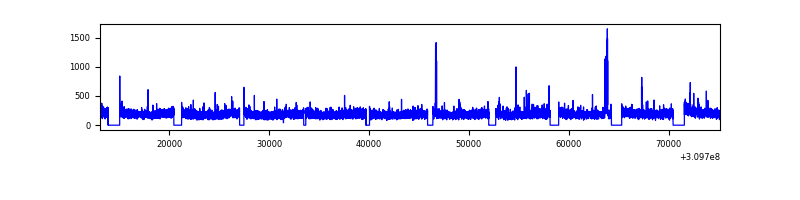 |
| D | 62068 | 54854 | 1787 | 1787 | 2.88% | 3.26% | 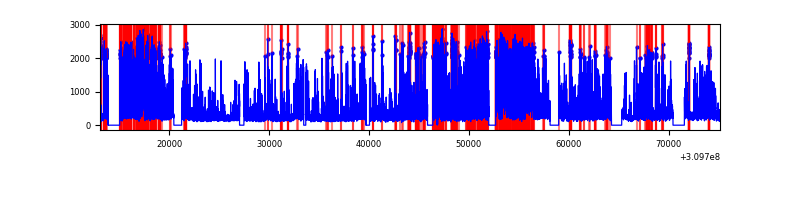 |
Top three noisy pixels from each quadrant. If the there are fewer than three noisy pixels in the level2.evt file, extra rows are filled as -1
| Pixel properties | Quadrant properties | ||||||
|---|---|---|---|---|---|---|---|
| Quadrant | DetID | PixID | Counts | Sigma | Mean | Median | Sigma |
| A | 5 | 16 | 140297 | 217.98 | 2899 | 2842 | 630.6 |
| A | 13 | 254 | 81528 | 124.78 | 2899 | 2842 | 630.6 |
| A | 0 | 226 | 18350 | 24.59 | 2899 | 2842 | 630.6 |
| B | 3 | 64 | 956322 | 1742.42 | 2914 | 2840 | 547.2 |
| B | 0 | 197 | 200543 | 361.29 | 2914 | 2840 | 547.2 |
| B | 0 | 230 | 196948 | 354.72 | 2914 | 2840 | 547.2 |
| C | 10 | 22 | 231143 | 350.35 | 2782 | 2765 | 651.9 |
| C | 8 | 128 | 25866 | 35.44 | 2782 | 2765 | 651.9 |
| C | 13 | 61 | 16092 | 20.44 | 2782 | 2765 | 651.9 |
| D | 1 | 52 | 12871842 | 20184.87 | 2757 | 2663 | 637.6 |
| D | 11 | 176 | 3603299 | 5647.48 | 2757 | 2663 | 637.6 |
| D | 10 | 1 | 345165 | 537.2 | 2757 | 2663 | 637.6 |
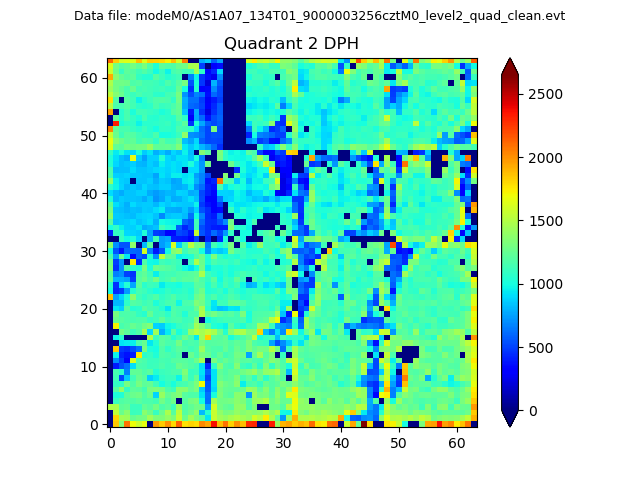
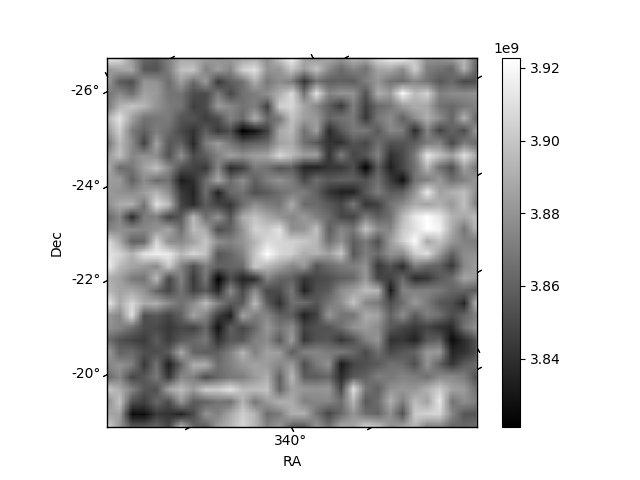
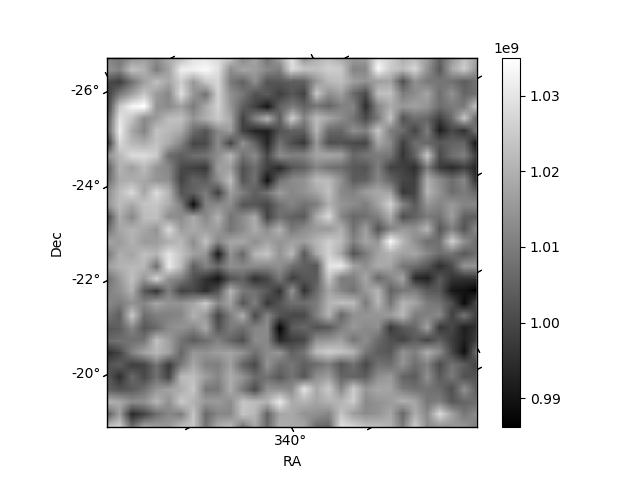
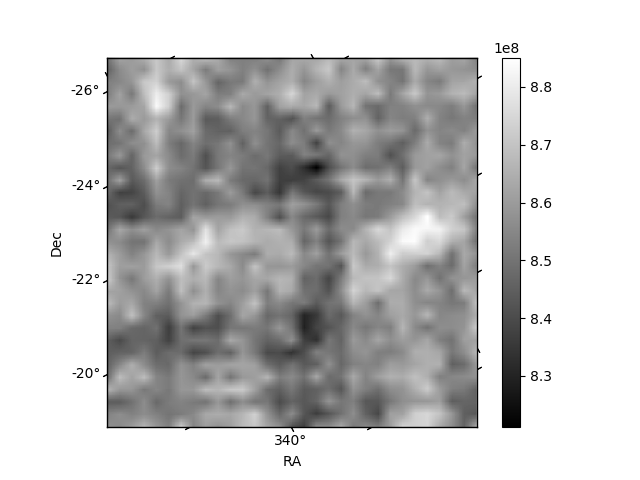
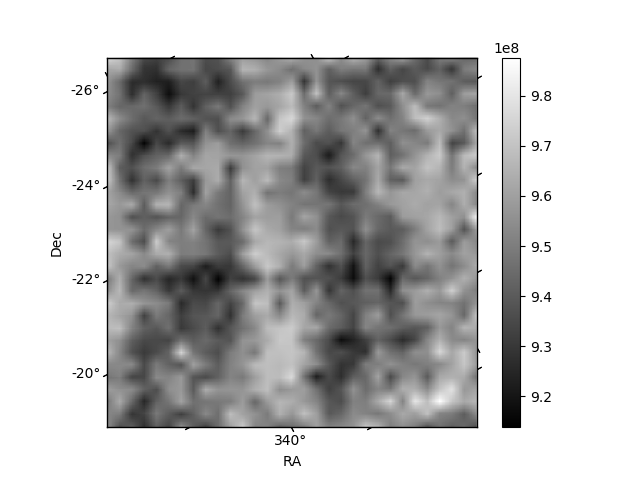
Histogram calculated using DETX and DETY for each event in the final _common_clean file
| Quadrant A | 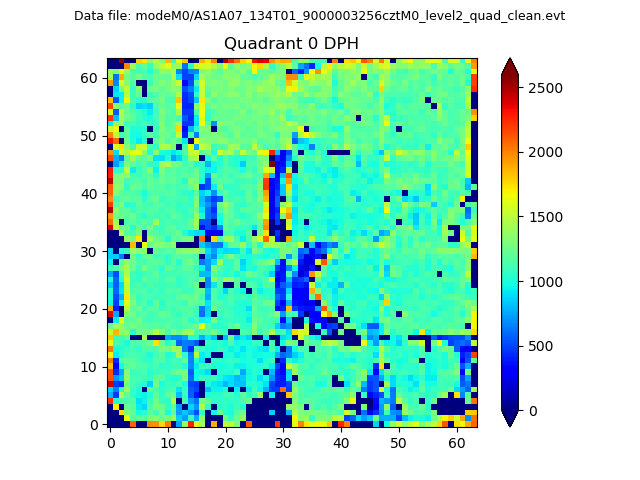 |
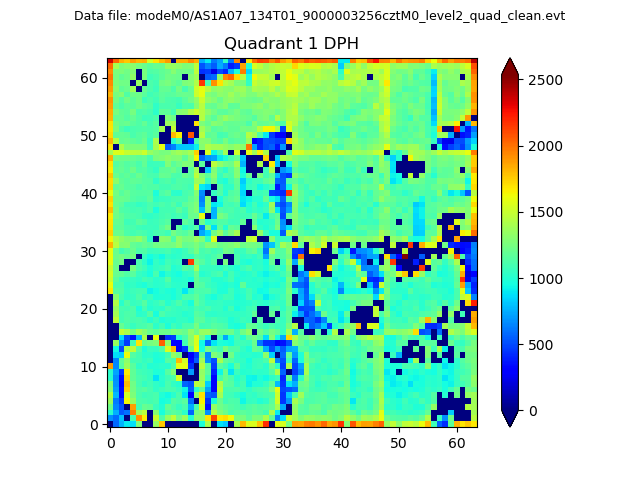 |
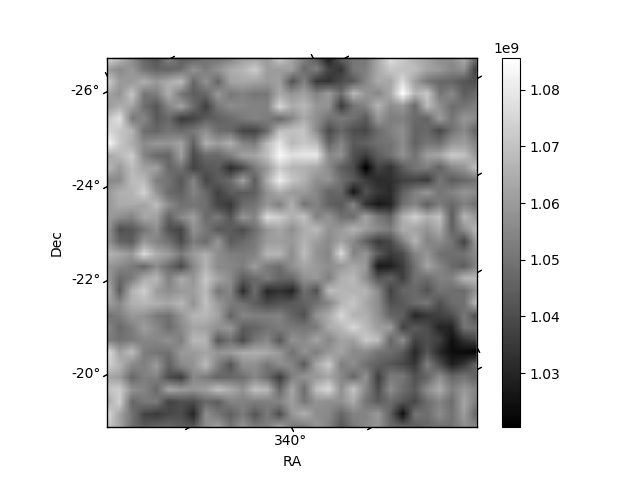
Quadrant B |
|---|---|---|---|
| Quadrant D | 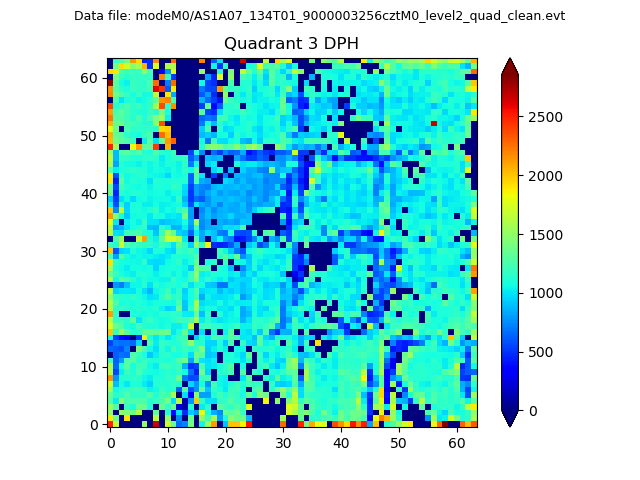 |
 |
Quadrant C |
| Plot type | Count rate plots | Images |
|---|---|---|
| Comparison with Poisson distribution Blue bars denote a histogram of data divided into 1 sec bins. Red curve is a Poisson curve with rate = median count rate of data. |
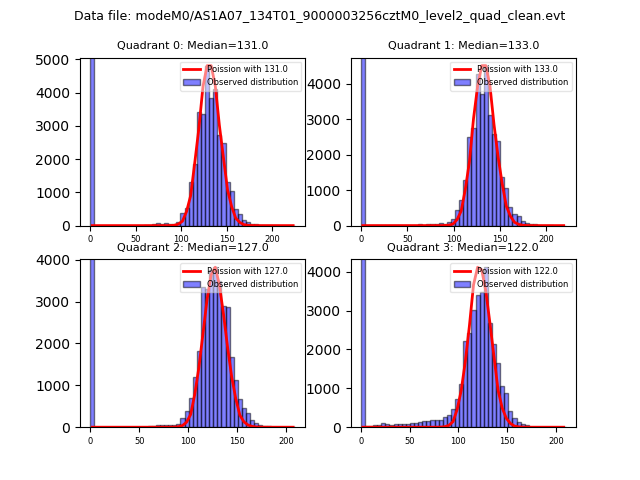 |
 |
| Quadrant-wise count rates Data is divided into 100 sec bins |
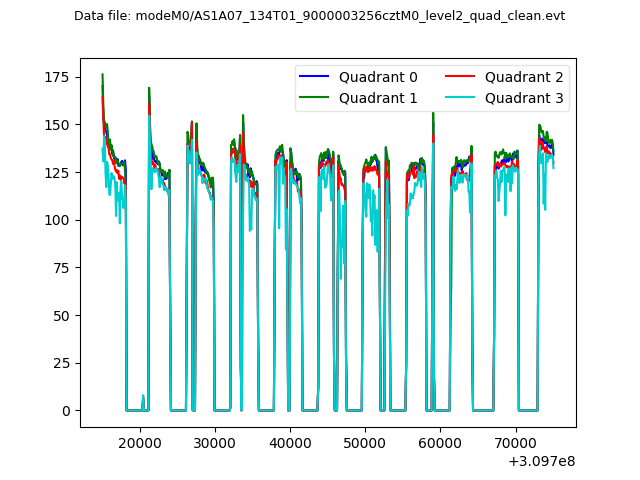 |
|
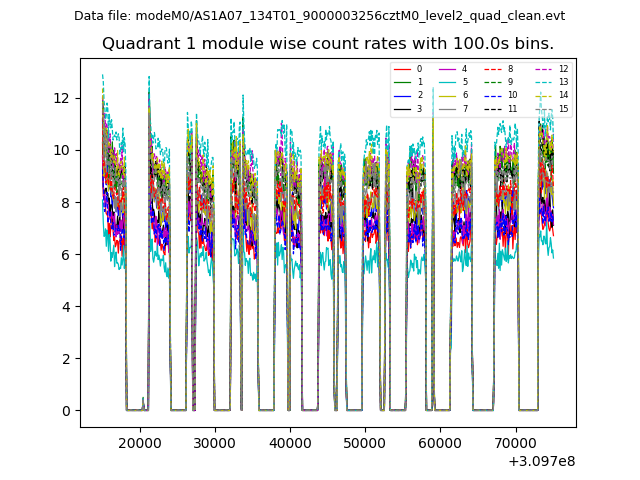
| Module-wise count rates for Quadrant A Data is divided into 100 sec bins |
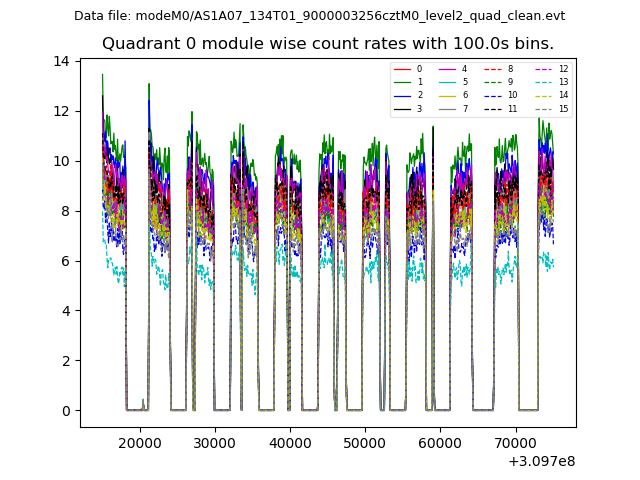 |
 |
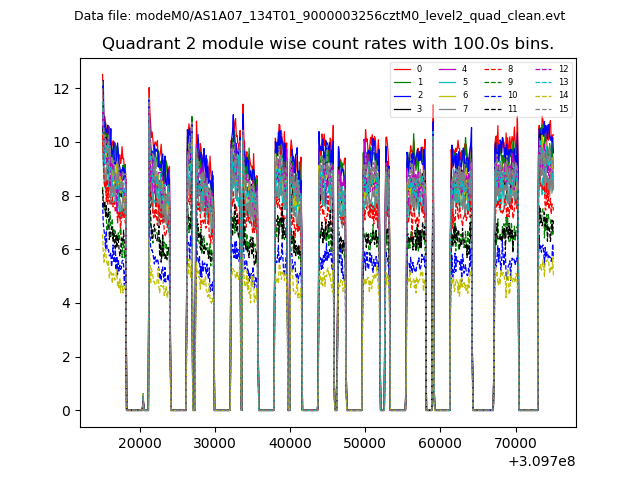
| Module-wise count rates for Quadrant B Data is divided into 100 sec bins |
 |
 |
| Module-wise count rates for Quadrant C Data is divided into 100 sec bins |
 |
 |
| Module-wise count rates for Quadrant D Data is divided into 100 sec bins |
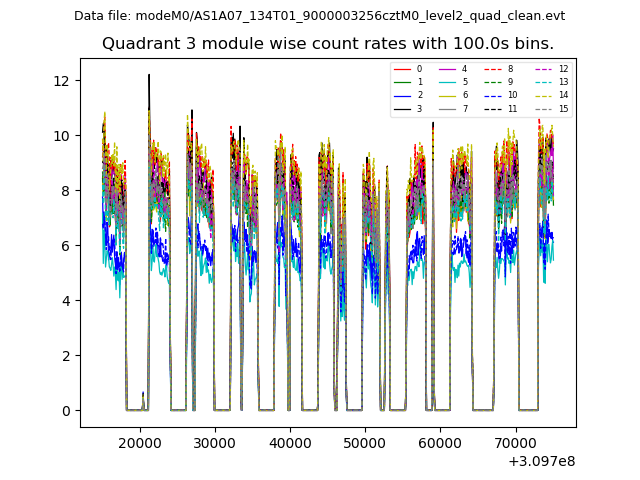 |
 |
| Parameter | Plot |
|---|---|
| CZT HV Monitor |  |
| D_VDD | 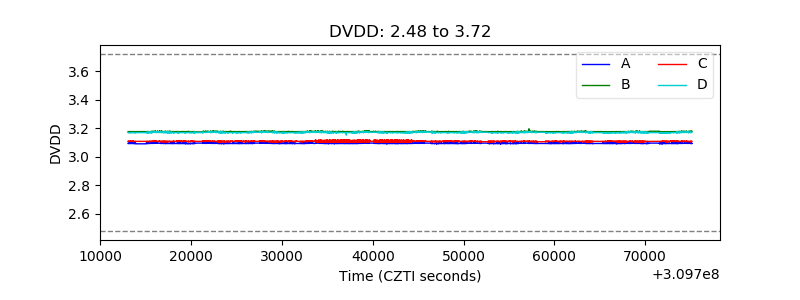 |
| Temperature 1 | 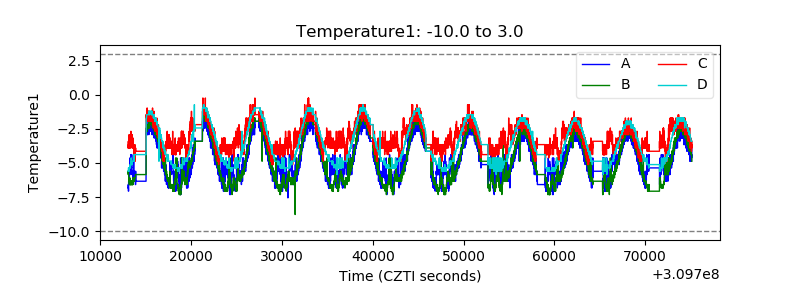 |
| Veto HV Monitor | 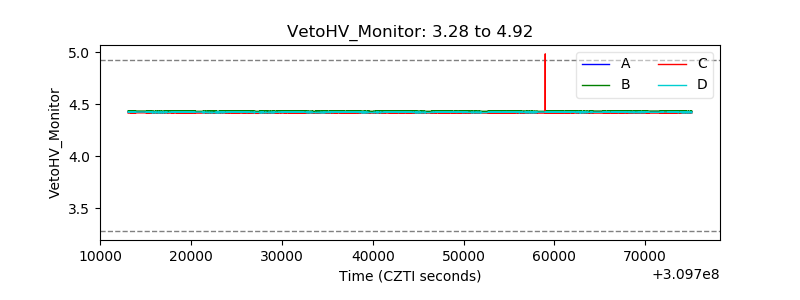 |
| Veto LLD | 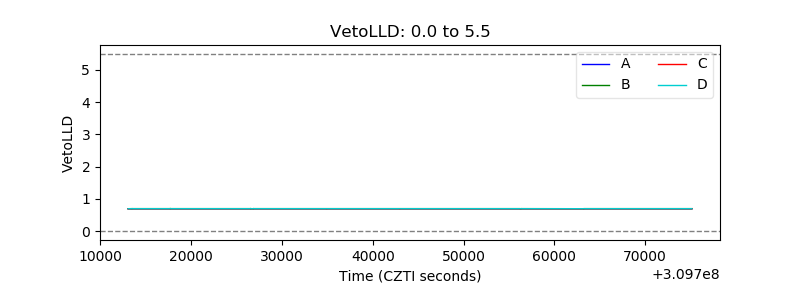 |
| Alpha Counter | 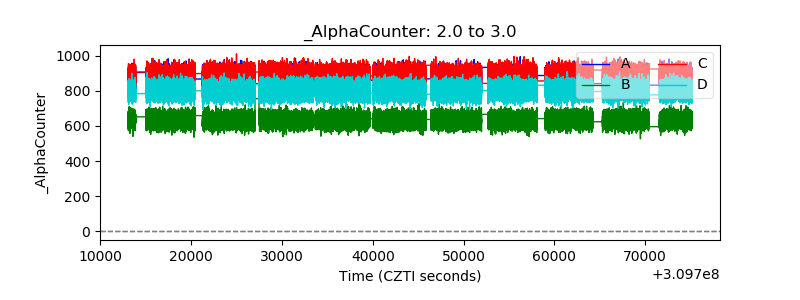 |
| _CPM_Rate | 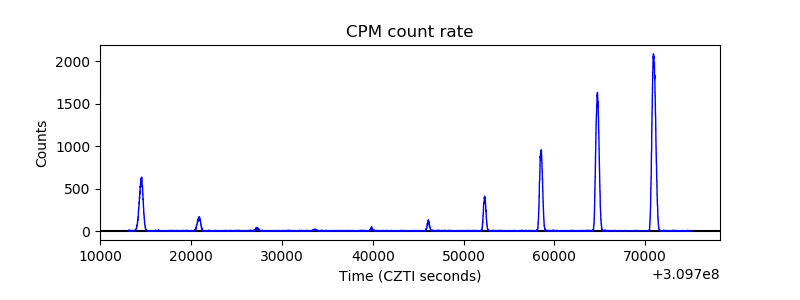 |
| CZT Counter | 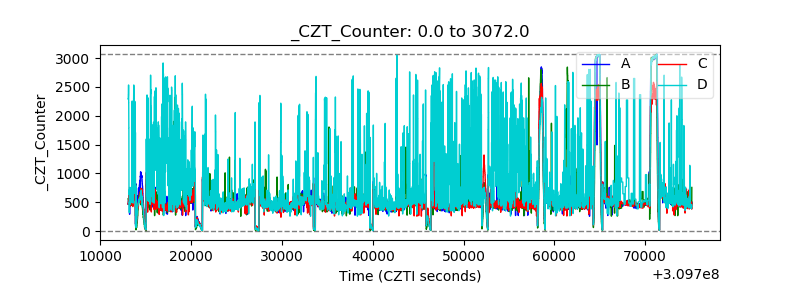 |
| +2.5 Volts monitor | 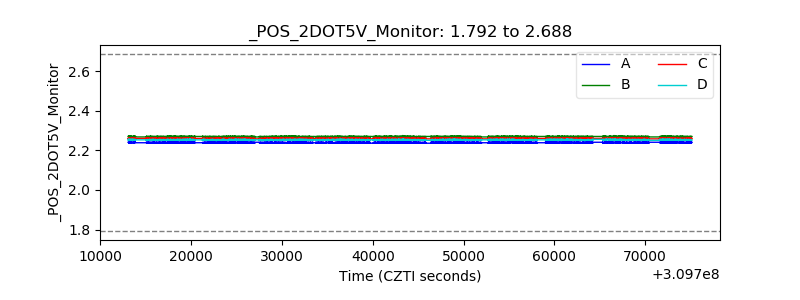 |
| +5 Volts monitor | 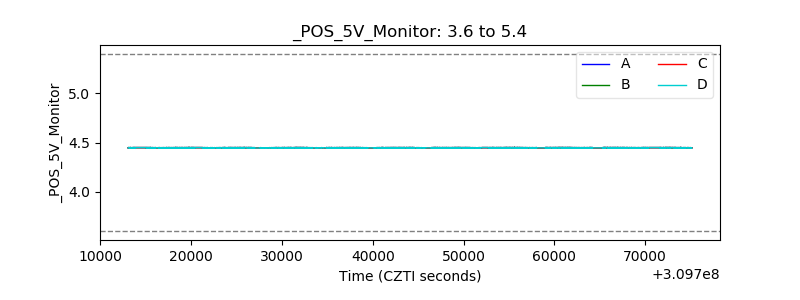 |
| _ROLL_ROT |  |
| _Roll_DEC | 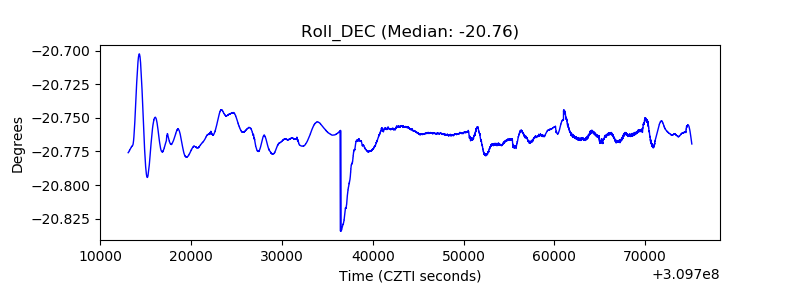 |
| _Roll_RA | 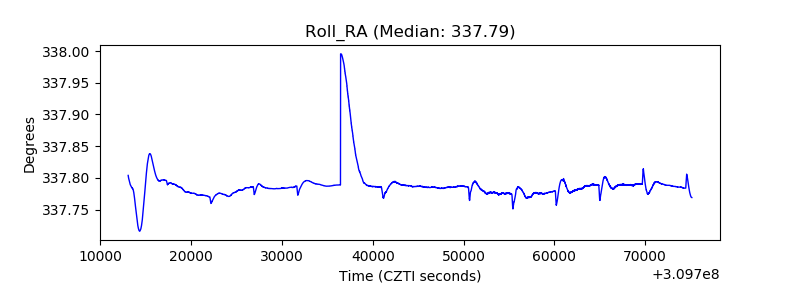 |
| Veto Counter | 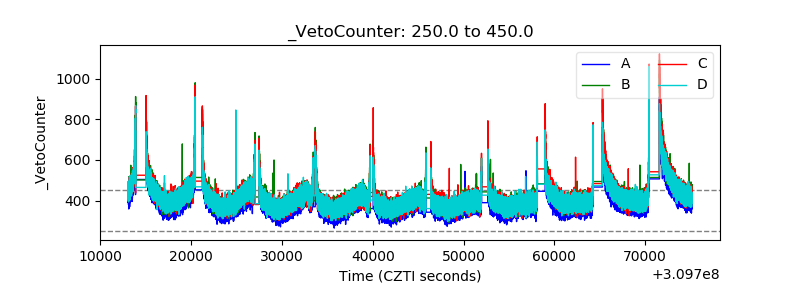 |