| Param | Original file | Final file |
|---|---|---|
| Filename | modeM0/AS1A07_027T02_9000003258cztM0_level2_bc.evt | modeM0/AS1A07_027T02_9000003258cztM0_level2_quad_clean.evt |
| Size (bytes) | 396,270,720 | 174,101,760 |
| Size | 377.9 MB | 166.0 MB |
| Events in quadrant A | 2,476,396 | 1,173,163 |
| Events in quadrant B | 2,753,636 | 1,182,364 |
| Events in quadrant C | 2,653,059 | 1,110,784 |
| Events in quadrant D | 3,419,550 | 1,103,982 |
| Mode SS | |||
|---|---|---|---|
| Quadrant | BADHDUFLAG | Total packets | Discarded packets |
| A | 0 | 208 | 0 |
| B | 0 | 208 | 0 |
| C | 0 | 208 | 0 |
| D | 0 | 208 | 0 |
| Mode M9 | |||
|---|---|---|---|
| Quadrant | BADHDUFLAG | Total packets | Discarded packets |
| A | 0 | 25 | 0 |
| B | 0 | 25 | 0 |
| C | 0 | 25 | 0 |
| D | 0 | 25 | 0 |
| Mode M0 | |||
|---|---|---|---|
| Quadrant | BADHDUFLAG | Total packets | Discarded packets |
| A | 0 | 22285 | 0 |
| B | 0 | 23194 | 0 |
| C | 0 | 23513 | 0 |
| D | 0 | 25473 | 0 |
| Quadrant | Total seconds | Saturated seconds | Saturation percentage |
|---|---|---|---|
| A | 10145 | 124 | 1.222277% |
| B | 10145 | 188 | 1.853130% |
| C | 10145 | 336 | 3.311976% |
| D | 10145 | 289 | 2.848694% |
Noise dominated data is calculated using 1-second bins in cleaned event files. If a bin has >2000 counts, and if more than 50% of those come from <1% of pixels, then it is considered to be noise-dominated and hence unusable.
| Quadrant | # 1 sec bins | Bins with >0 counts | Bins with >2000 counts | High rate bins dominated by noise | Noise dominated (total time) | Noise dominated (detector-on time) | Marked lightcurve |
|---|---|---|---|---|---|---|---|
| A | 12695 | 10143 | 0 | 0 | 0.00% | 0.00% |  |
| B | 12695 | 10144 | 13 | 13 | 0.10% | 0.13% | 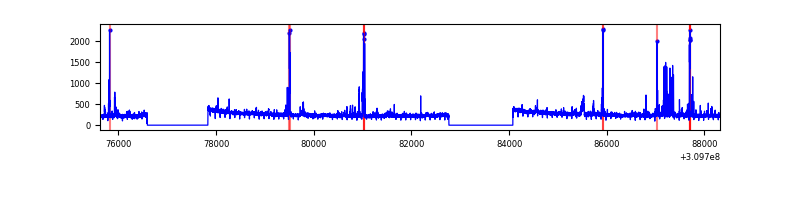 |
| C | 12695 | 10143 | 11 | 11 | 0.09% | 0.11% |  |
| D | 12695 | 10143 | 26 | 26 | 0.20% | 0.26% |  |
Top three noisy pixels from each quadrant. If the there are fewer than three noisy pixels in the level2.evt file, extra rows are filled as -1
| Pixel properties | Quadrant properties | ||||||
|---|---|---|---|---|---|---|---|
| Quadrant | DetID | PixID | Counts | Sigma | Mean | Median | Sigma |
| A | 13 | 254 | 14361 | 100.86 | 641 | 633 | 136.1 |
| A | 3 | 1 | 6983 | 46.65 | 641 | 633 | 136.1 |
| A | 0 | 226 | 4153 | 25.86 | 641 | 633 | 136.1 |
| B | 3 | 64 | 132455 | 1091.28 | 645 | 633 | 120.8 |
| B | 4 | 171 | 74311 | 609.94 | 645 | 633 | 120.8 |
| B | 0 | 197 | 31913 | 258.95 | 645 | 633 | 120.8 |
| C | 10 | 22 | 325003 | 2318.2 | 603 | 602 | 139.9 |
| C | 8 | 208 | 7046 | 46.05 | 603 | 602 | 139.9 |
| C | 4 | 175 | 3661 | 21.86 | 603 | 602 | 139.9 |
| D | 11 | 176 | 522561 | 3657.34 | 622 | 601 | 142.7 |
| D | 1 | 52 | 202943 | 1417.8 | 622 | 601 | 142.7 |
| D | 7 | 238 | 146057 | 1019.2 | 622 | 601 | 142.7 |
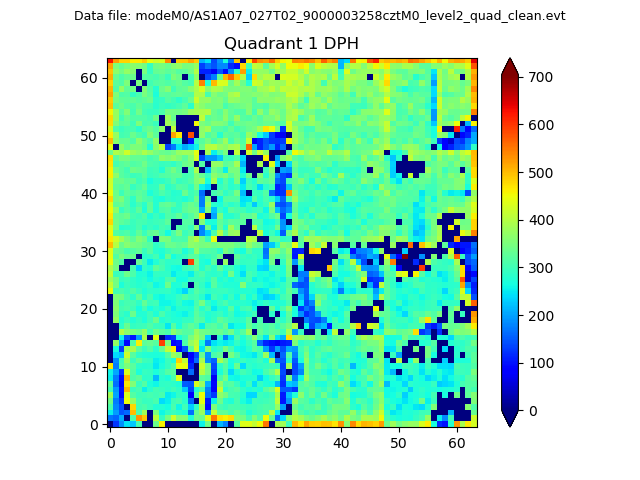
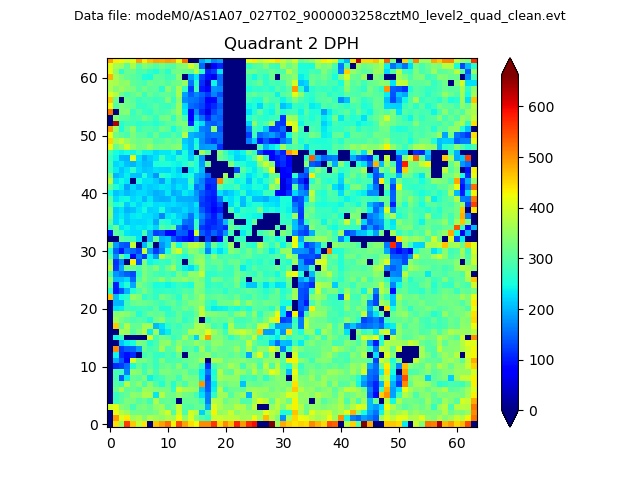
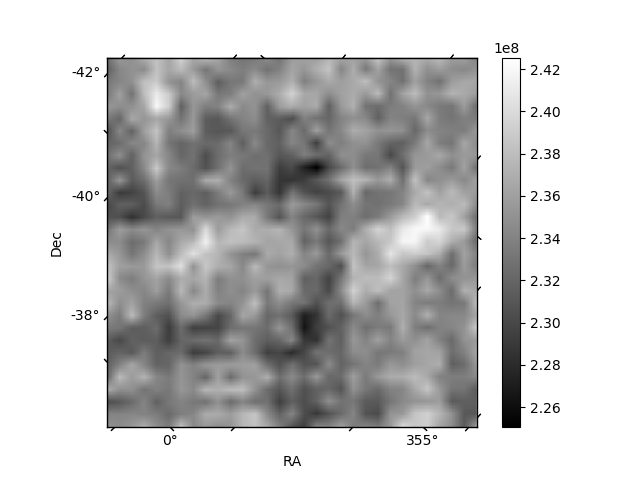
Histogram calculated using DETX and DETY for each event in the final _common_clean file
| Quadrant A |  |
 |
Quadrant B |
|---|---|---|---|
| Quadrant D |  |
 |
Quadrant C |
| Plot type | Count rate plots | Images |
|---|---|---|
| Comparison with Poisson distribution Blue bars denote a histogram of data divided into 1 sec bins. Red curve is a Poisson curve with rate = median count rate of data. |
 |
 |
| Quadrant-wise count rates Data is divided into 100 sec bins |
 |
|
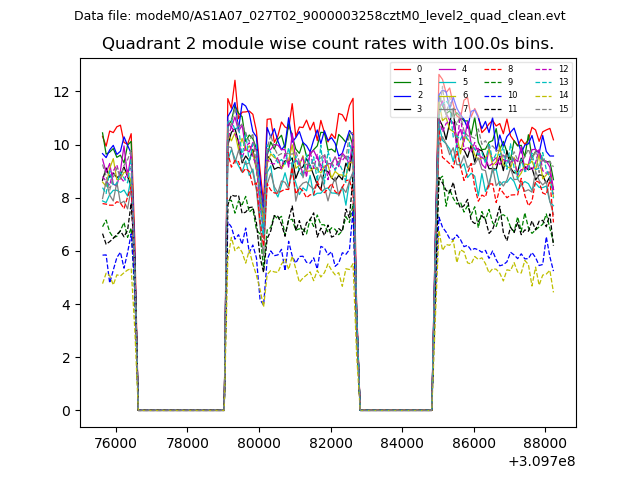
| Module-wise count rates for Quadrant A Data is divided into 100 sec bins |
 |
 |
| Module-wise count rates for Quadrant B Data is divided into 100 sec bins |
 |
 |
| Module-wise count rates for Quadrant C Data is divided into 100 sec bins |
 |
 |
| Module-wise count rates for Quadrant D Data is divided into 100 sec bins |
 |
 |
| Parameter | Plot |
|---|---|
| CZT HV Monitor |  |
| D_VDD | 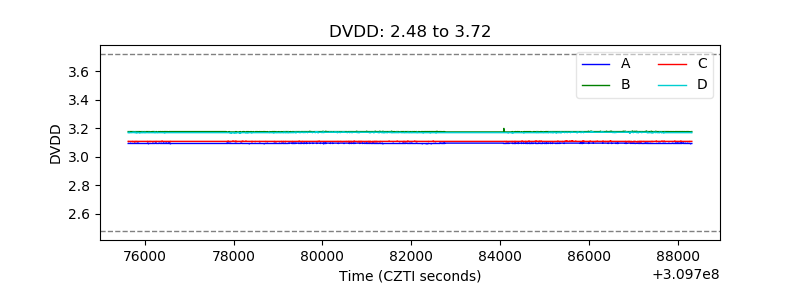 |
| Temperature 1 |  |
| Veto HV Monitor |  |
| Veto LLD | 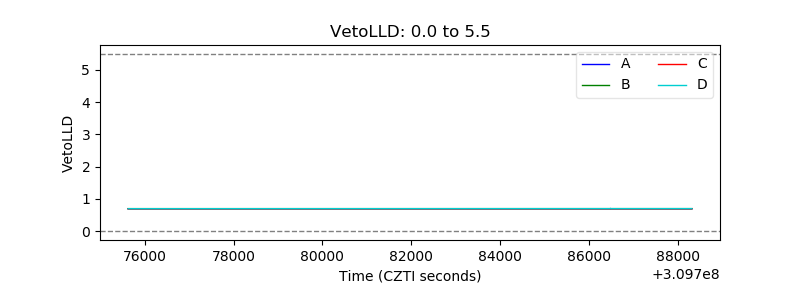 |
| Alpha Counter |  |
| _CPM_Rate |  |
| CZT Counter |  |
| +2.5 Volts monitor |  |
| +5 Volts monitor |  |
| _ROLL_ROT |  |
| _Roll_DEC | 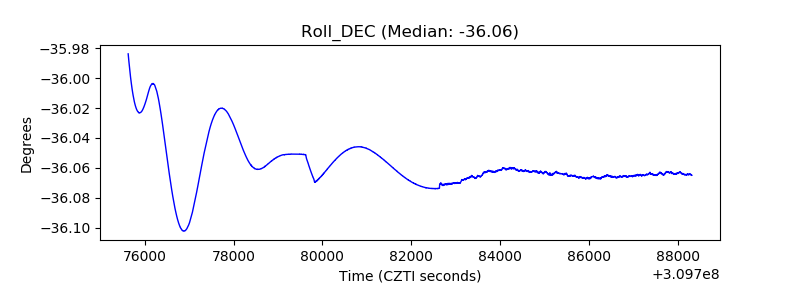 |
| _Roll_RA |  |
| Veto Counter |  |