| Param | Original file | Final file |
|---|---|---|
| Filename | modeM0/AS1A07_047T08_9000003262cztM0_level2_bc.evt | modeM0/AS1A07_047T08_9000003262cztM0_level2_quad_clean.evt |
| Size (bytes) | 352,656,000 | 189,521,280 |
| Size | 336.3 MB | 180.7 MB |
| Events in quadrant A | 2,057,498 | 1,296,054 |
| Events in quadrant B | 2,209,878 | 1,313,807 |
| Events in quadrant C | 1,946,737 | 1,255,800 |
| Events in quadrant D | 3,796,601 | 1,201,391 |
| Mode M9 | |||
|---|---|---|---|
| Quadrant | BADHDUFLAG | Total packets | Discarded packets |
| A | 0 | 17 | 0 |
| B | 0 | 17 | 0 |
| C | 0 | 17 | 0 |
| D | 0 | 17 | 0 |
| Mode M0 | |||
|---|---|---|---|
| Quadrant | BADHDUFLAG | Total packets | Discarded packets |
| A | 0 | 20107 | 0 |
| B | 0 | 20582 | 0 |
| C | 0 | 20102 | 0 |
| D | 0 | 26661 | 0 |
| Mode SS | |||
|---|---|---|---|
| Quadrant | BADHDUFLAG | Total packets | Discarded packets |
| A | 0 | 196 | 0 |
| B | 0 | 196 | 0 |
| C | 0 | 196 | 0 |
| D | 0 | 196 | 0 |
| Quadrant | Total seconds | Saturated seconds | Saturation percentage |
|---|---|---|---|
| A | 9723 | 106 | 1.090198% |
| B | 9723 | 138 | 1.419315% |
| C | 9723 | 115 | 1.182763% |
| D | 9723 | 558 | 5.738969% |
Noise dominated data is calculated using 1-second bins in cleaned event files. If a bin has >2000 counts, and if more than 50% of those come from <1% of pixels, then it is considered to be noise-dominated and hence unusable.
| Quadrant | # 1 sec bins | Bins with >0 counts | Bins with >2000 counts | High rate bins dominated by noise | Noise dominated (total time) | Noise dominated (detector-on time) | Marked lightcurve |
|---|---|---|---|---|---|---|---|
| A | 11358 | 9721 | 0 | 0 | 0.00% | 0.00% | 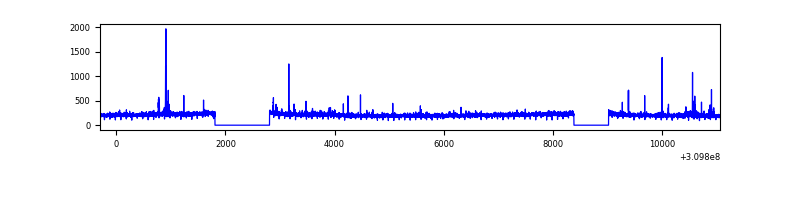 |
| B | 11358 | 9722 | 10 | 10 | 0.09% | 0.10% | 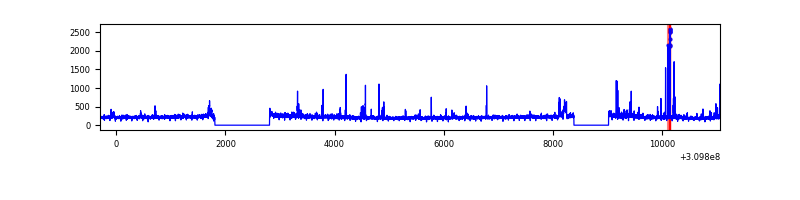 |
| C | 11358 | 9722 | 0 | 0 | 0.00% | 0.00% | 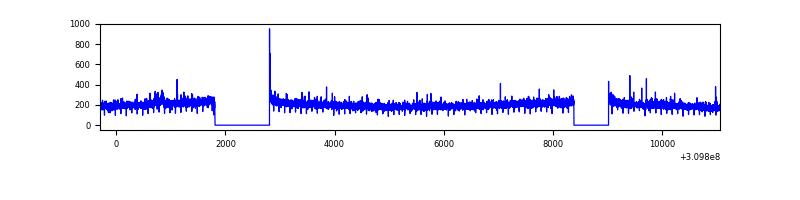 |
| D | 11358 | 9722 | 64 | 64 | 0.56% | 0.66% | 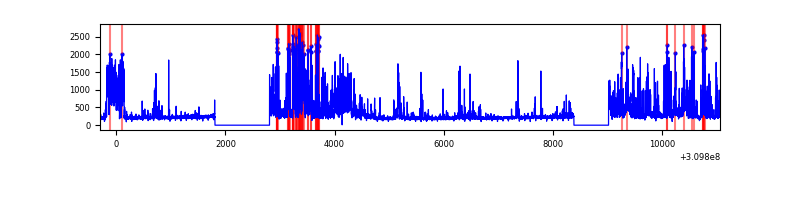 |
Top three noisy pixels from each quadrant. If the there are fewer than three noisy pixels in the level2.evt file, extra rows are filled as -1
| Pixel properties | Quadrant properties | ||||||
|---|---|---|---|---|---|---|---|
| Quadrant | DetID | PixID | Counts | Sigma | Mean | Median | Sigma |
| A | 5 | 16 | 35182 | 297.56 | 519 | 510 | 116.5 |
| A | 13 | 254 | 14652 | 121.37 | 519 | 510 | 116.5 |
| A | 15 | 236 | 13033 | 107.47 | 519 | 510 | 116.5 |
| B | 3 | 64 | 62572 | 618.62 | 522 | 509 | 100.3 |
| B | 0 | 230 | 29627 | 290.24 | 522 | 509 | 100.3 |
| B | 0 | 197 | 25817 | 252.26 | 522 | 509 | 100.3 |
| C | 10 | 22 | 9365 | 73.91 | 499 | 497 | 120.0 |
| C | 3 | 233 | 8629 | 67.78 | 499 | 497 | 120.0 |
| C | 4 | 175 | 7275 | 56.49 | 499 | 497 | 120.0 |
| D | 12 | 233 | 481096 | 4049.92 | 500 | 484 | 118.7 |
| D | 11 | 176 | 395028 | 3324.66 | 500 | 484 | 118.7 |
| D | 5 | 222 | 278450 | 2342.3 | 500 | 484 | 118.7 |
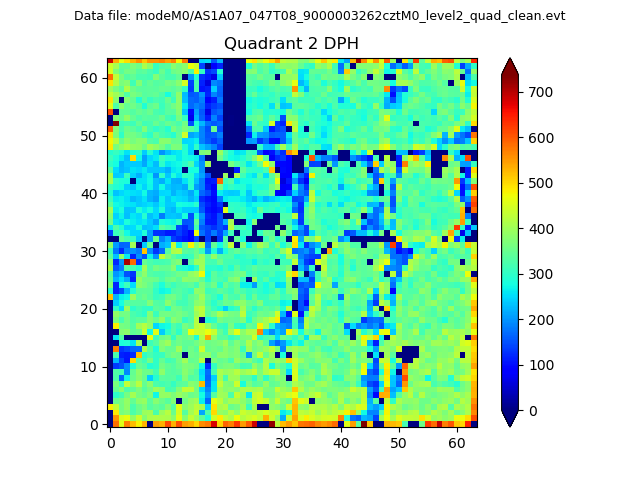
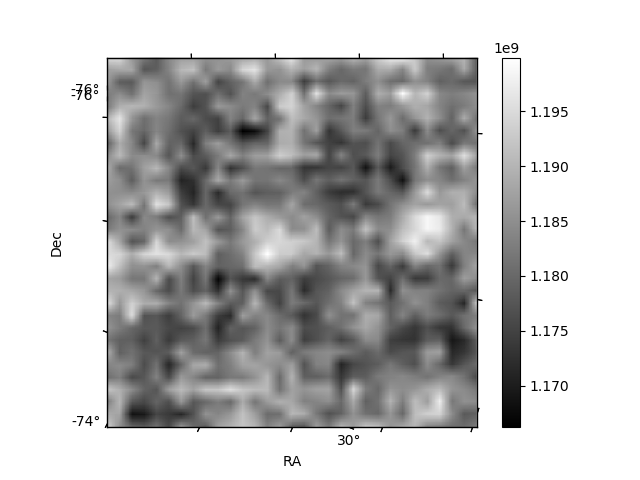
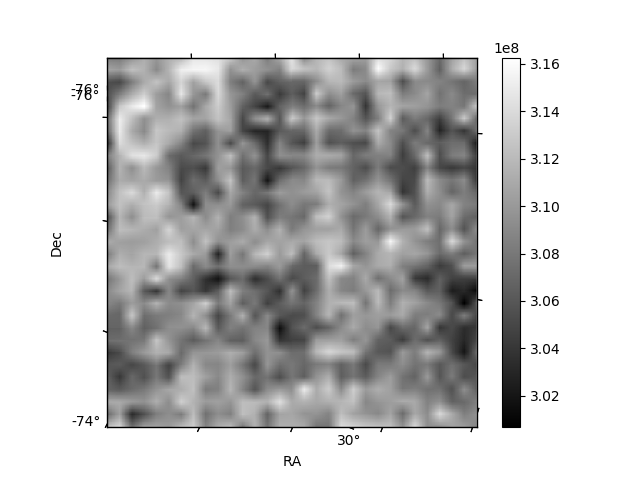
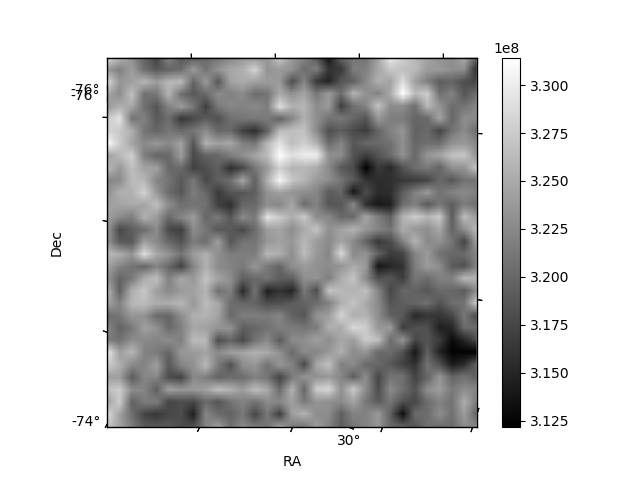
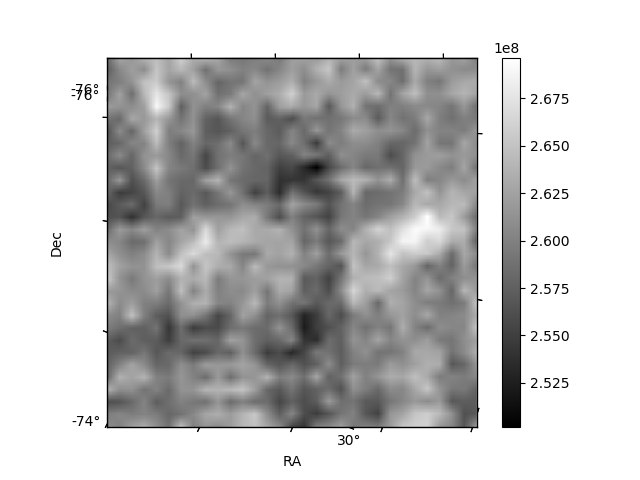
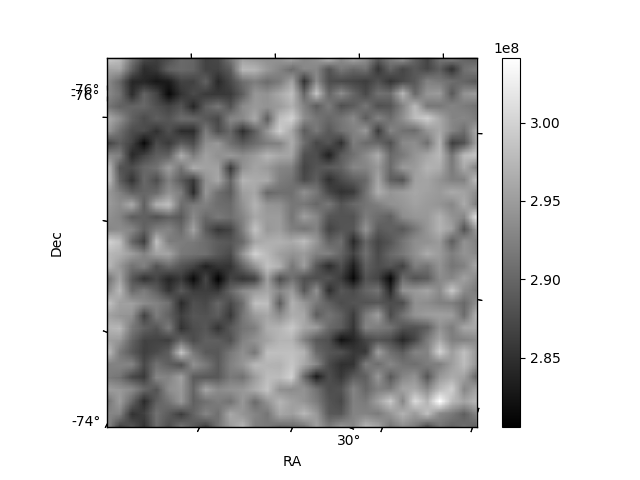
Histogram calculated using DETX and DETY for each event in the final _common_clean file
| Quadrant A | 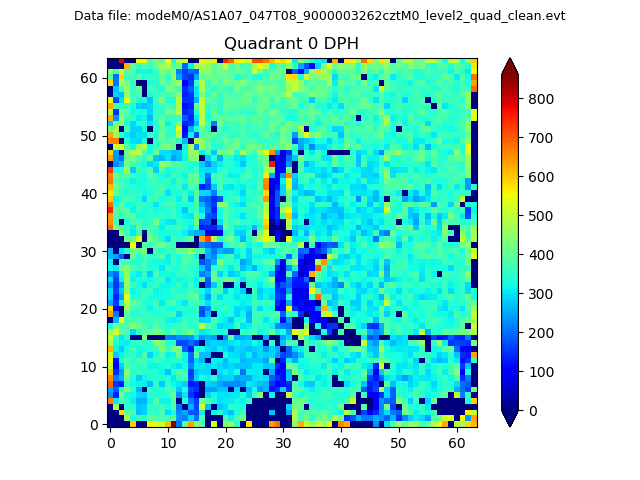 |
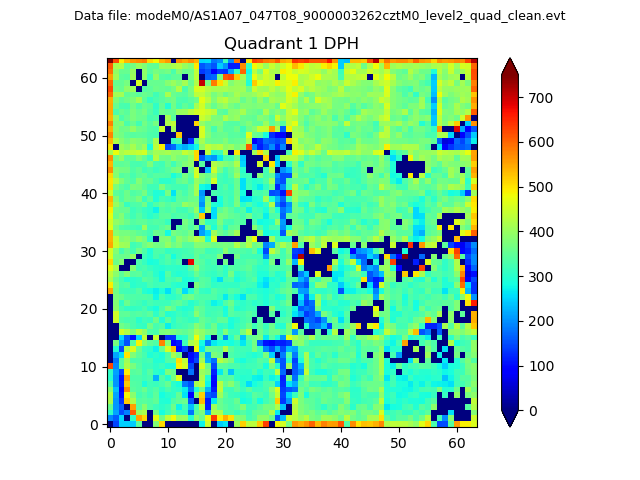 |
Quadrant B |
|---|---|---|---|
| Quadrant D | 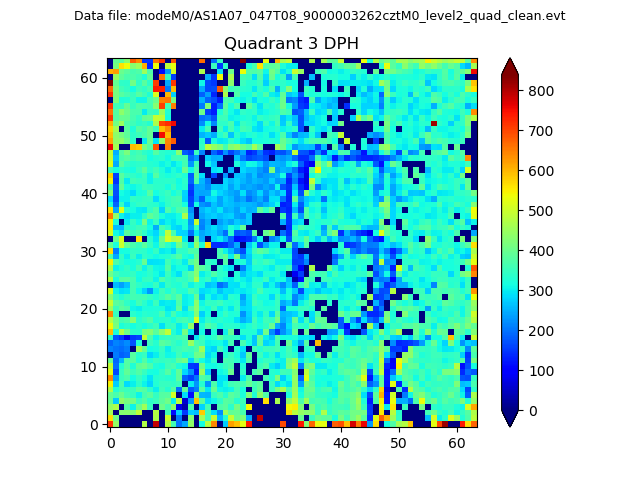 |
 |
Quadrant C |
| Plot type | Count rate plots | Images |
|---|---|---|
| Comparison with Poisson distribution Blue bars denote a histogram of data divided into 1 sec bins. Red curve is a Poisson curve with rate = median count rate of data. |
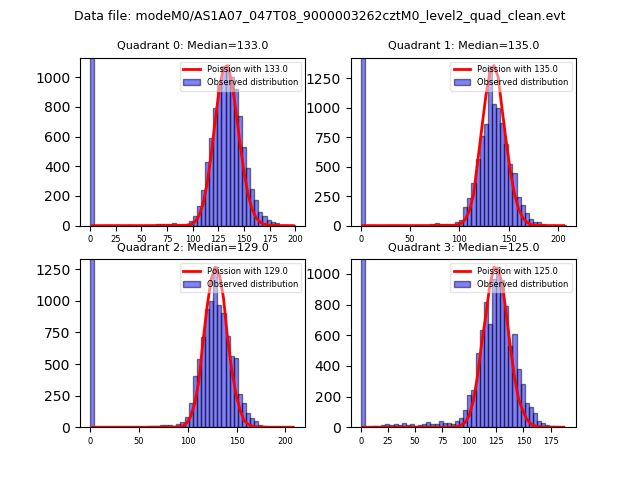 |
 |
| Quadrant-wise count rates Data is divided into 100 sec bins |
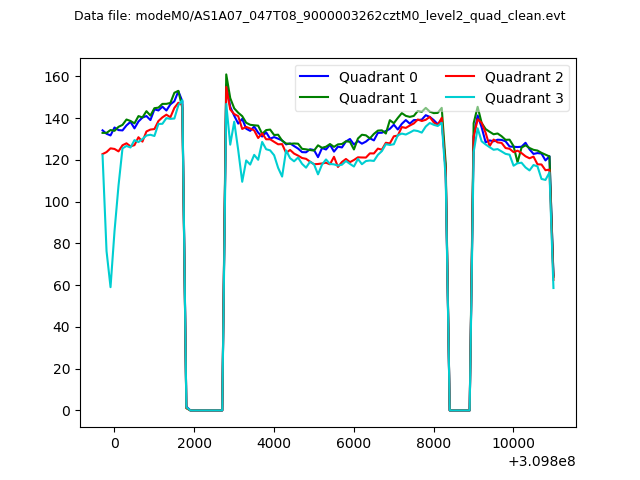 |
|
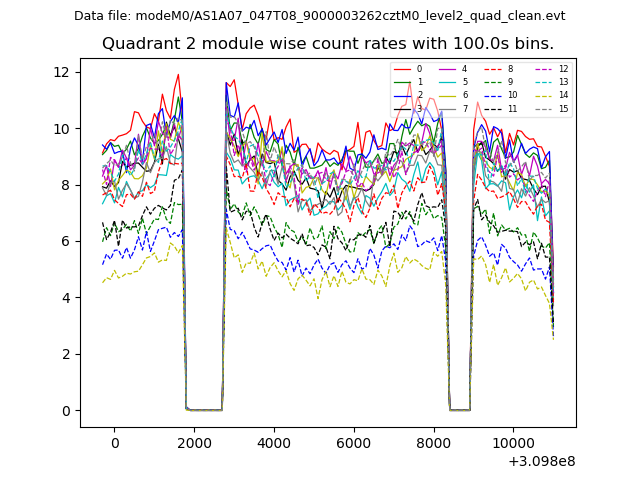
| Module-wise count rates for Quadrant A Data is divided into 100 sec bins |
 |
 |
| Module-wise count rates for Quadrant B Data is divided into 100 sec bins |
 |
 |
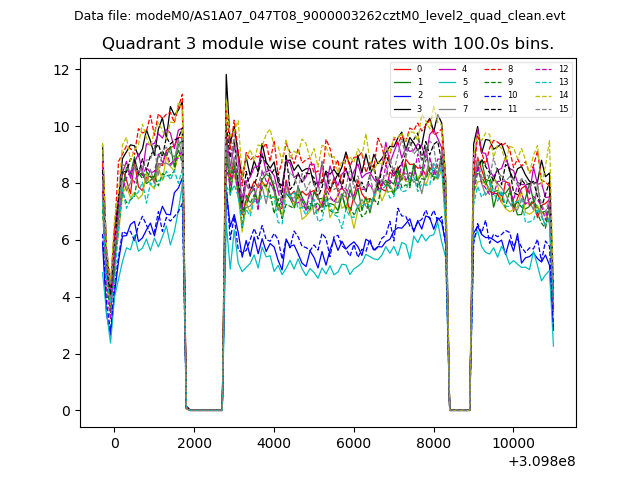
| Module-wise count rates for Quadrant C Data is divided into 100 sec bins |
 |
 |
| Module-wise count rates for Quadrant D Data is divided into 100 sec bins |
 |
 |
| Parameter | Plot |
|---|---|
| CZT HV Monitor | 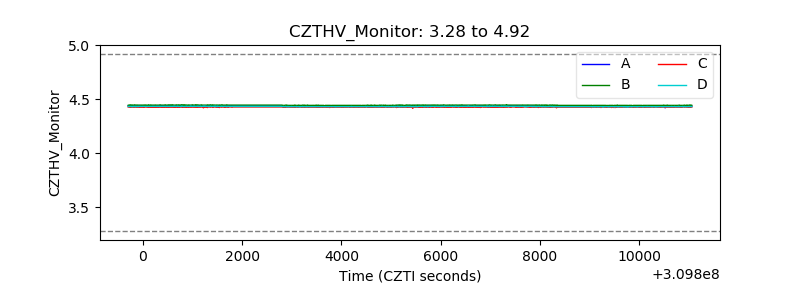 |
| D_VDD | 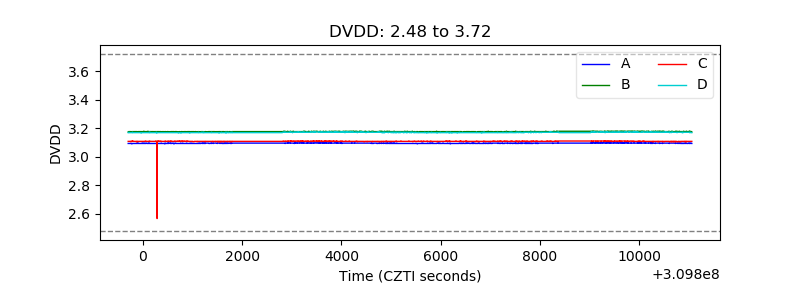 |
| Temperature 1 | 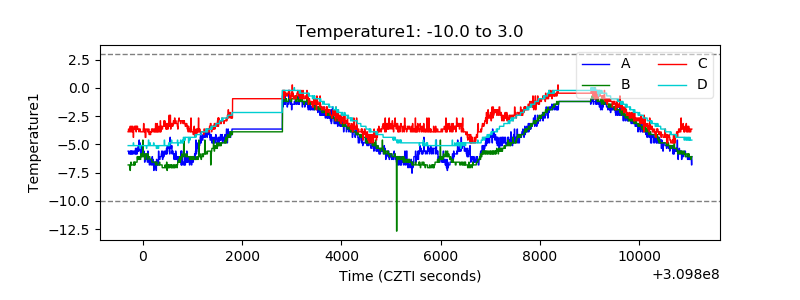 |
| Veto HV Monitor | 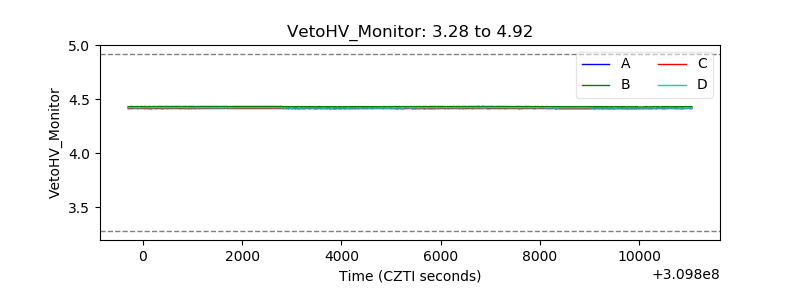 |
| Veto LLD | 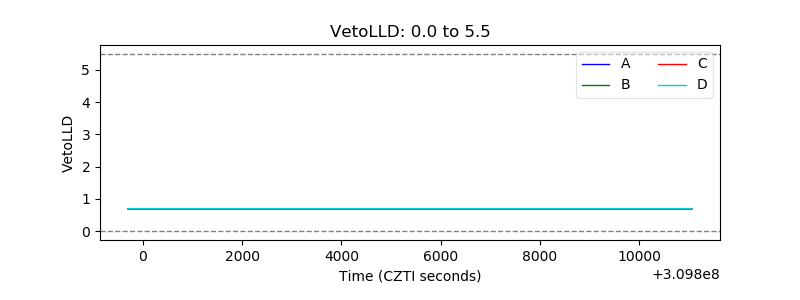 |
| Alpha Counter | 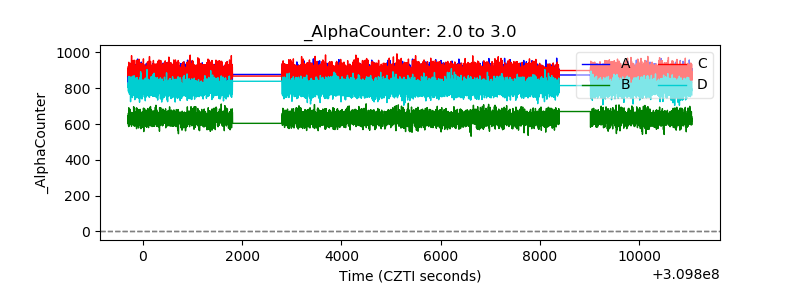 |
| _CPM_Rate | 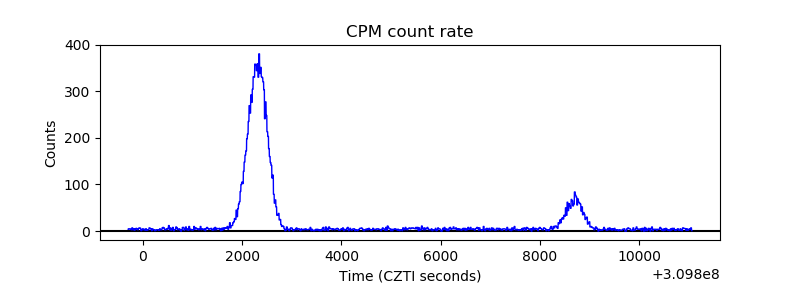 |
| CZT Counter | 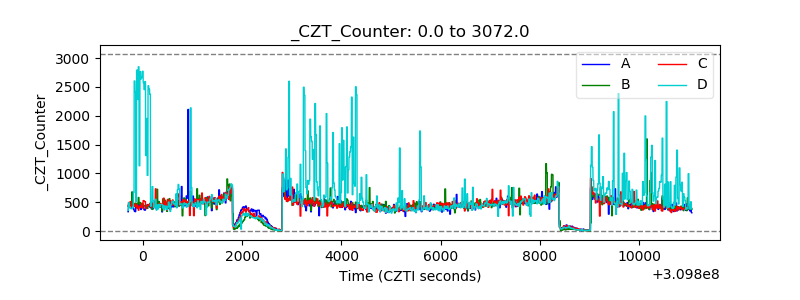 |
| +2.5 Volts monitor | 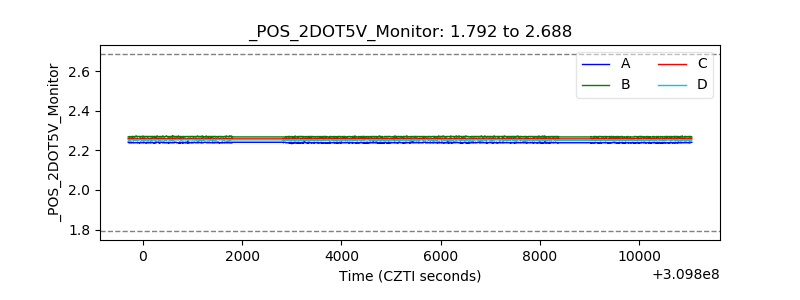 |
| +5 Volts monitor | 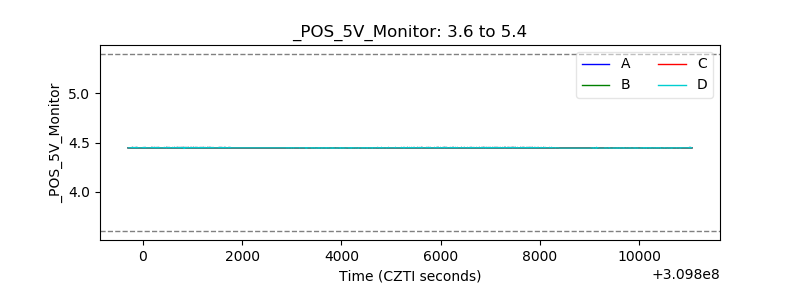 |
| _ROLL_ROT | 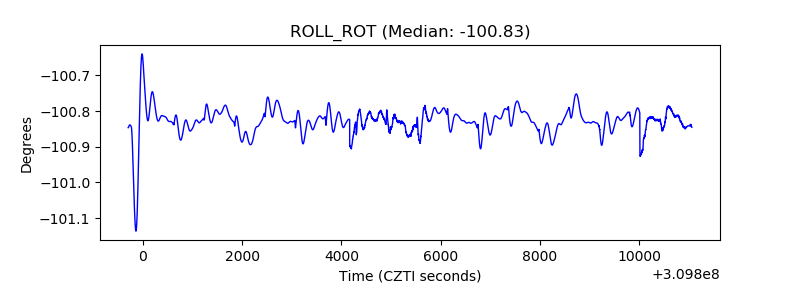 |
| _Roll_DEC | 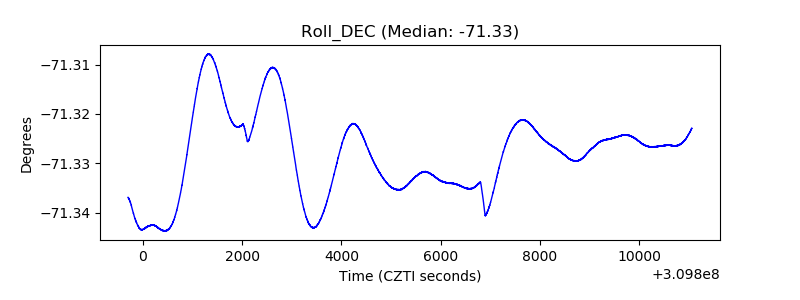 |
| _Roll_RA | 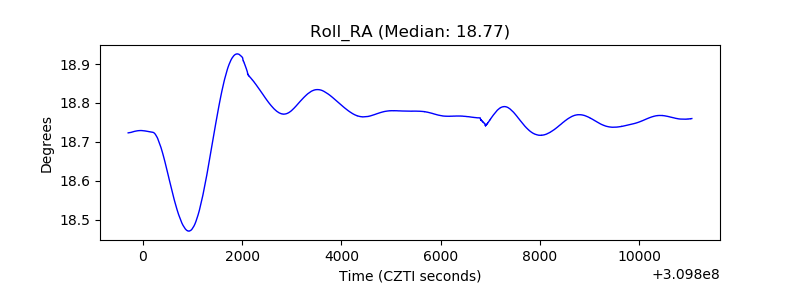 |
| Veto Counter | 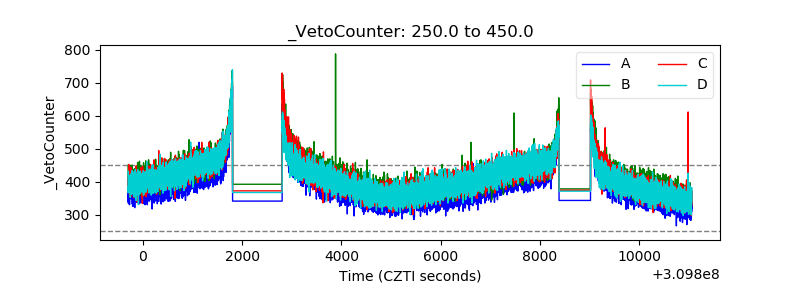 |