| Param | Original file | Final file |
|---|---|---|
| Filename | modeM0/AS1A07_167T01_9000003264cztM0_level2_bc.evt | modeM0/AS1A07_167T01_9000003264cztM0_level2_quad_clean.evt |
| Size (bytes) | 2,100,101,760 | 825,719,040 |
| Size | 2.0 GB | 787.5 MB |
| Events in quadrant A | 12,735,056 | 5,402,115 |
| Events in quadrant B | 12,734,200 | 5,489,456 |
| Events in quadrant C | 11,471,890 | 5,257,711 |
| Events in quadrant D | 22,845,077 | 5,021,994 |
| Mode M0 | |||
|---|---|---|---|
| Quadrant | BADHDUFLAG | Total packets | Discarded packets |
| A | 0 | 119176 | 0 |
| B | 0 | 118706 | 0 |
| C | 0 | 116122 | 0 |
| D | 0 | 155651 | 0 |
| Mode M9 | |||
|---|---|---|---|
| Quadrant | BADHDUFLAG | Total packets | Discarded packets |
| A | 0 | 85 | 0 |
| B | 0 | 85 | 0 |
| C | 0 | 85 | 0 |
| D | 0 | 85 | 0 |
| Mode SS | |||
|---|---|---|---|
| Quadrant | BADHDUFLAG | Total packets | Discarded packets |
| A | 0 | 1134 | 0 |
| B | 0 | 1134 | 0 |
| C | 0 | 1134 | 0 |
| D | 0 | 1134 | 0 |
| Quadrant | Total seconds | Saturated seconds | Saturation percentage |
|---|---|---|---|
| A | 55995 | 492 | 0.878650% |
| B | 55995 | 554 | 0.989374% |
| C | 55995 | 637 | 1.137602% |
| D | 55995 | 3405 | 6.080900% |
Noise dominated data is calculated using 1-second bins in cleaned event files. If a bin has >2000 counts, and if more than 50% of those come from <1% of pixels, then it is considered to be noise-dominated and hence unusable.
| Quadrant | # 1 sec bins | Bins with >0 counts | Bins with >2000 counts | High rate bins dominated by noise | Noise dominated (total time) | Noise dominated (detector-on time) | Marked lightcurve |
|---|---|---|---|---|---|---|---|
| A | 64229 | 55989 | 6 | 6 | 0.01% | 0.01% |  |
| B | 64229 | 55987 | 10 | 10 | 0.02% | 0.02% |  |
| C | 64229 | 55985 | 0 | 0 | 0.00% | 0.00% | 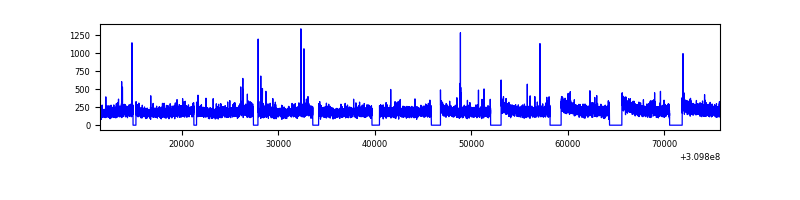 |
| D | 64230 | 55989 | 756 | 756 | 1.18% | 1.35% |  |
Top three noisy pixels from each quadrant. If the there are fewer than three noisy pixels in the level2.evt file, extra rows are filled as -1
| Pixel properties | Quadrant properties | ||||||
|---|---|---|---|---|---|---|---|
| Quadrant | DetID | PixID | Counts | Sigma | Mean | Median | Sigma |
| A | 5 | 16 | 944616 | 1440.22 | 3047 | 2997 | 653.8 |
| A | 13 | 254 | 84056 | 123.98 | 3047 | 2997 | 653.8 |
| A | 3 | 1 | 20641 | 26.99 | 3047 | 2997 | 653.8 |
| B | 3 | 64 | 275542 | 477.4 | 3072 | 3011 | 570.9 |
| B | 0 | 197 | 182345 | 314.14 | 3072 | 3011 | 570.9 |
| B | 0 | 230 | 169942 | 292.42 | 3072 | 3011 | 570.9 |
| C | 10 | 22 | 53075 | 71.27 | 2958 | 2954 | 703.2 |
| C | 13 | 61 | 16946 | 19.9 | 2958 | 2954 | 703.2 |
| C | 8 | 128 | 14517 | 16.44 | 2958 | 2954 | 703.2 |
| D | 1 | 52 | 7667812 | 11115.76 | 2954 | 2860 | 689.6 |
| D | 7 | 238 | 804794 | 1162.97 | 2954 | 2860 | 689.6 |
| D | 7 | 38 | 648911 | 936.91 | 2954 | 2860 | 689.6 |
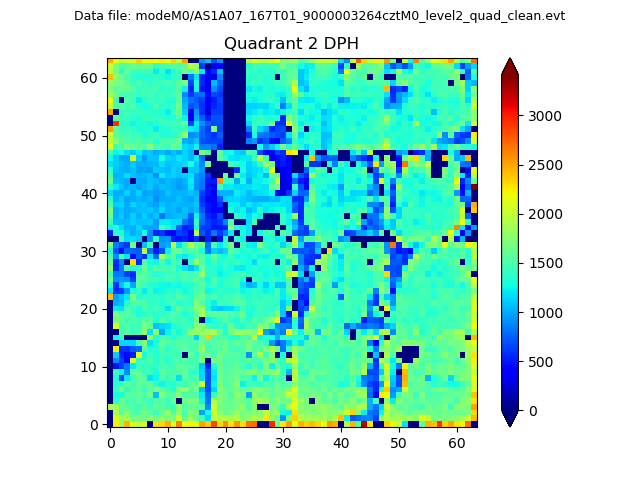
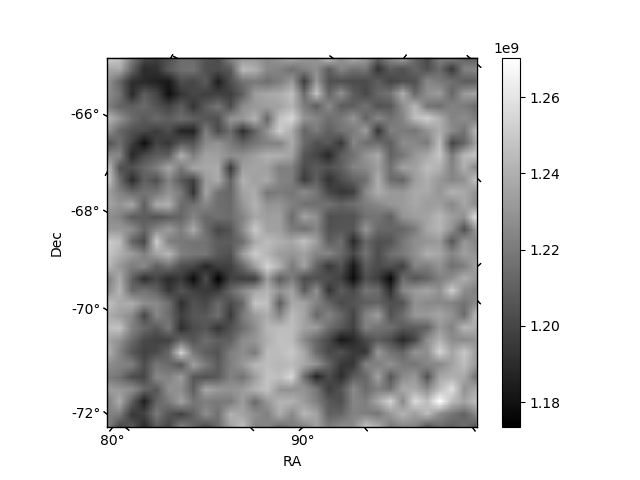
Histogram calculated using DETX and DETY for each event in the final _common_clean file
| Quadrant A |  |
 |
Quadrant B |
|---|---|---|---|
| Quadrant D |  |
 |
Quadrant C |
| Plot type | Count rate plots | Images |
|---|---|---|
| Comparison with Poisson distribution Blue bars denote a histogram of data divided into 1 sec bins. Red curve is a Poisson curve with rate = median count rate of data. |
 |
 |
| Quadrant-wise count rates Data is divided into 100 sec bins |
 |
|
| Module-wise count rates for Quadrant A Data is divided into 100 sec bins |
 |
 |
| Module-wise count rates for Quadrant B Data is divided into 100 sec bins |
 |
 |
| Module-wise count rates for Quadrant C Data is divided into 100 sec bins |
 |
 |
| Module-wise count rates for Quadrant D Data is divided into 100 sec bins |
 |
 |
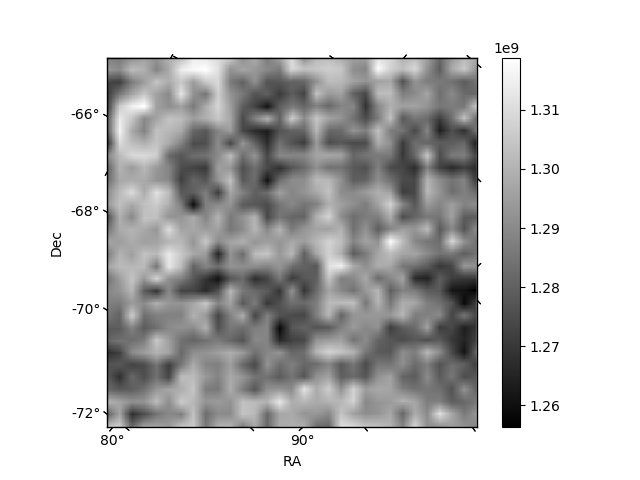
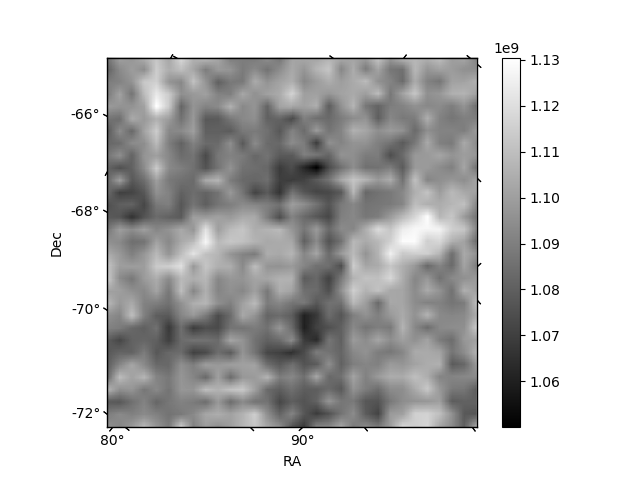
| Parameter | Plot |
|---|---|
| CZT HV Monitor |  |
| D_VDD |  |
| Temperature 1 |  |
| Veto HV Monitor |  |
| Veto LLD |  |
| Alpha Counter |  |
| _CPM_Rate |  |
| CZT Counter |  |
| +2.5 Volts monitor |  |
| +5 Volts monitor |  |
| _ROLL_ROT |  |
| _Roll_DEC |  |
| _Roll_RA | 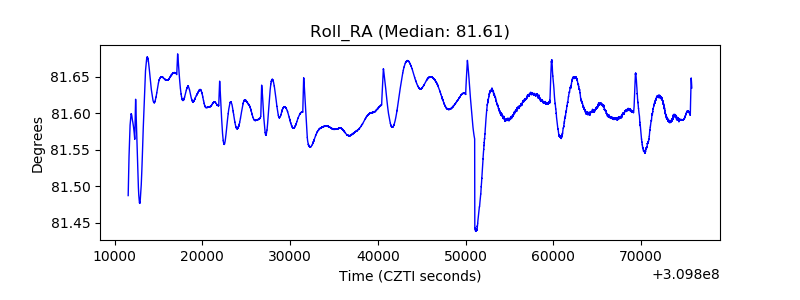 |
| Veto Counter | 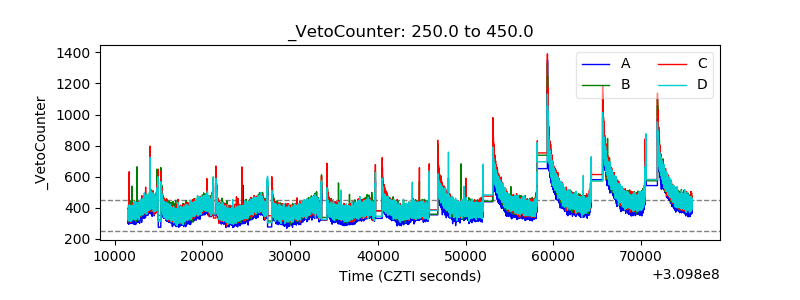 |