| Param | Original file | Final file |
|---|---|---|
| Filename | modeM0/AS1A07_149T01_9000003266cztM0_level2_bc.evt | modeM0/AS1A07_149T01_9000003266cztM0_level2_quad_clean.evt |
| Size (bytes) | 1,230,131,520 | 553,452,480 |
| Size | 1.1 GB | 527.8 MB |
| Events in quadrant A | 7,301,971 | 3,670,604 |
| Events in quadrant B | 7,773,538 | 3,712,868 |
| Events in quadrant C | 7,035,587 | 3,532,084 |
| Events in quadrant D | 12,725,628 | 3,417,358 |
| Mode M0 | |||
|---|---|---|---|
| Quadrant | BADHDUFLAG | Total packets | Discarded packets |
| A | 0 | 73002 | 0 |
| B | 0 | 74524 | 0 |
| C | 0 | 73232 | 0 |
| D | 0 | 93812 | 0 |
| Mode SS | |||
|---|---|---|---|
| Quadrant | BADHDUFLAG | Total packets | Discarded packets |
| A | 0 | 724 | 0 |
| B | 0 | 724 | 0 |
| C | 0 | 724 | 0 |
| D | 0 | 724 | 0 |
| Mode M9 | |||
|---|---|---|---|
| Quadrant | BADHDUFLAG | Total packets | Discarded packets |
| A | 0 | 47 | 0 |
| B | 0 | 47 | 0 |
| C | 0 | 47 | 0 |
| D | 0 | 47 | 0 |
| Quadrant | Total seconds | Saturated seconds | Saturation percentage |
|---|---|---|---|
| A | 35389 | 361 | 1.020091% |
| B | 35389 | 548 | 1.548504% |
| C | 35389 | 589 | 1.664359% |
| D | 35389 | 2111 | 5.965130% |
Noise dominated data is calculated using 1-second bins in cleaned event files. If a bin has >2000 counts, and if more than 50% of those come from <1% of pixels, then it is considered to be noise-dominated and hence unusable.
| Quadrant | # 1 sec bins | Bins with >0 counts | Bins with >2000 counts | High rate bins dominated by noise | Noise dominated (total time) | Noise dominated (detector-on time) | Marked lightcurve |
|---|---|---|---|---|---|---|---|
| A | 40183 | 35384 | 0 | 0 | 0.00% | 0.00% |  |
| B | 40183 | 35385 | 11 | 11 | 0.03% | 0.03% |  |
| C | 40183 | 35387 | 0 | 0 | 0.00% | 0.00% | 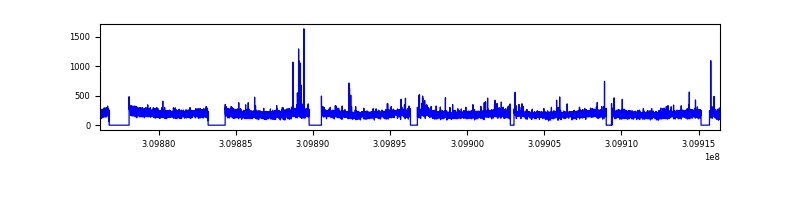 |
| D | 40183 | 35387 | 261 | 261 | 0.65% | 0.74% |  |
Top three noisy pixels from each quadrant. If the there are fewer than three noisy pixels in the level2.evt file, extra rows are filled as -1
| Pixel properties | Quadrant properties | ||||||
|---|---|---|---|---|---|---|---|
| Quadrant | DetID | PixID | Counts | Sigma | Mean | Median | Sigma |
| A | 13 | 254 | 51013 | 120.31 | 1880 | 1847 | 408.7 |
| A | 2 | 79 | 20601 | 45.89 | 1880 | 1847 | 408.7 |
| A | 3 | 1 | 20437 | 45.49 | 1880 | 1847 | 408.7 |
| B | 3 | 64 | 193662 | 533.16 | 1892 | 1845 | 359.8 |
| B | 0 | 230 | 73494 | 199.15 | 1892 | 1845 | 359.8 |
| B | 0 | 197 | 57698 | 155.25 | 1892 | 1845 | 359.8 |
| C | 10 | 22 | 57268 | 128.96 | 1804 | 1796 | 430.2 |
| C | 8 | 208 | 27305 | 59.3 | 1804 | 1796 | 430.2 |
| C | 13 | 61 | 10450 | 20.12 | 1804 | 1796 | 430.2 |
| D | 1 | 52 | 2712278 | 6373.46 | 1812 | 1750 | 425.3 |
| D | 13 | 249 | 557944 | 1307.82 | 1812 | 1750 | 425.3 |
| D | 13 | 172 | 455165 | 1066.15 | 1812 | 1750 | 425.3 |
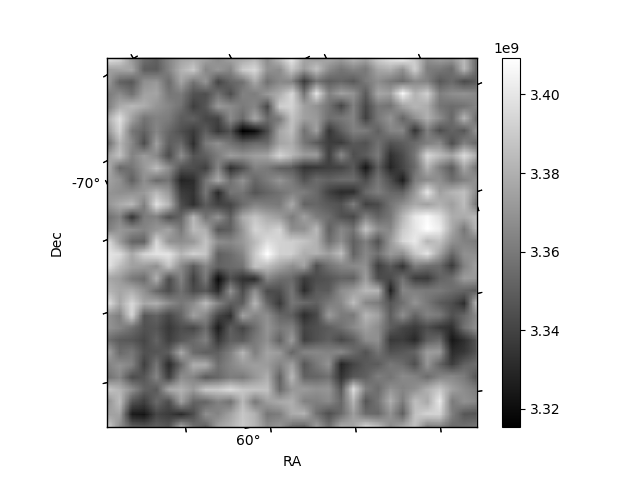
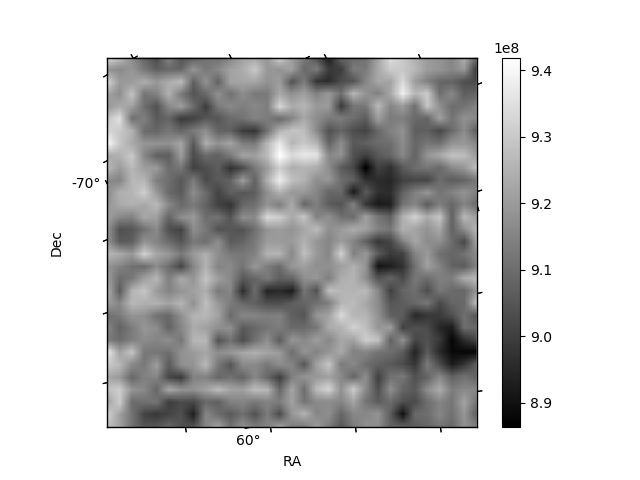
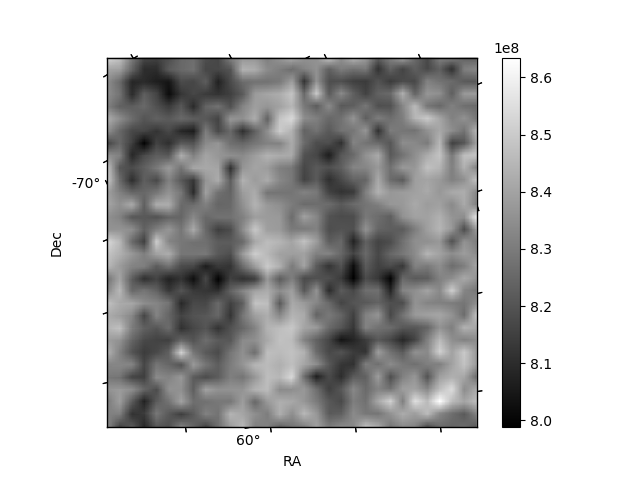
Histogram calculated using DETX and DETY for each event in the final _common_clean file
| Quadrant A | 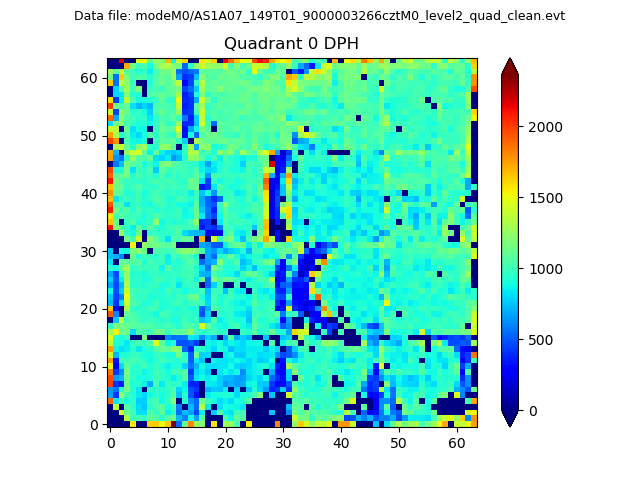 |
 |
Quadrant B |
|---|---|---|---|
| Quadrant D | 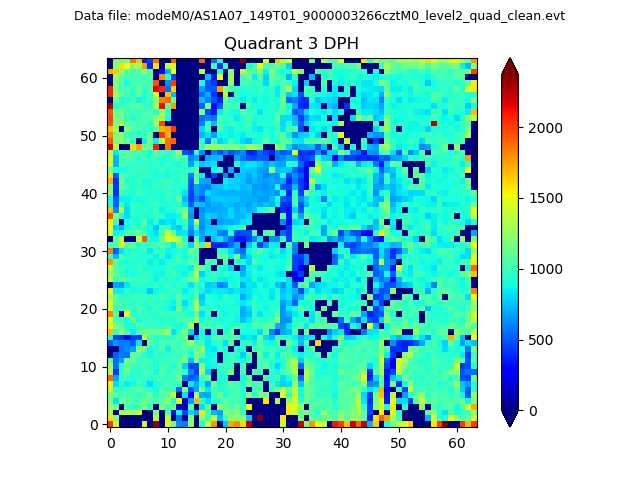 |
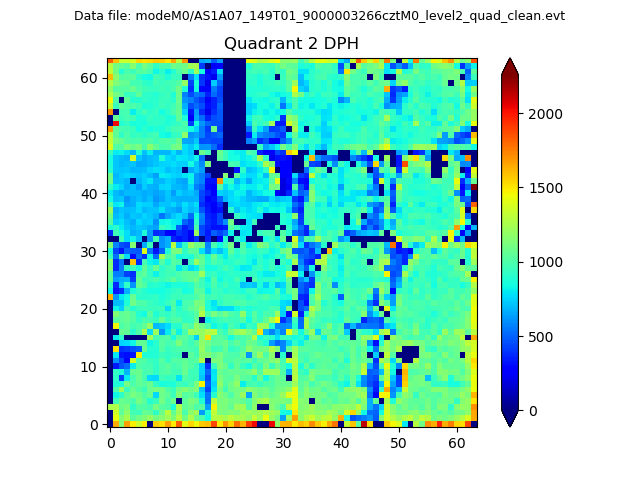 |
Quadrant C |
| Plot type | Count rate plots | Images |
|---|---|---|
| Comparison with Poisson distribution Blue bars denote a histogram of data divided into 1 sec bins. Red curve is a Poisson curve with rate = median count rate of data. |
 |
 |
| Quadrant-wise count rates Data is divided into 100 sec bins |
 |
|
| Module-wise count rates for Quadrant A Data is divided into 100 sec bins |
 |
 |
| Module-wise count rates for Quadrant B Data is divided into 100 sec bins |
 |
 |
| Module-wise count rates for Quadrant C Data is divided into 100 sec bins |
 |
 |
| Module-wise count rates for Quadrant D Data is divided into 100 sec bins |
 |
 |
| Parameter | Plot |
|---|---|
| CZT HV Monitor | 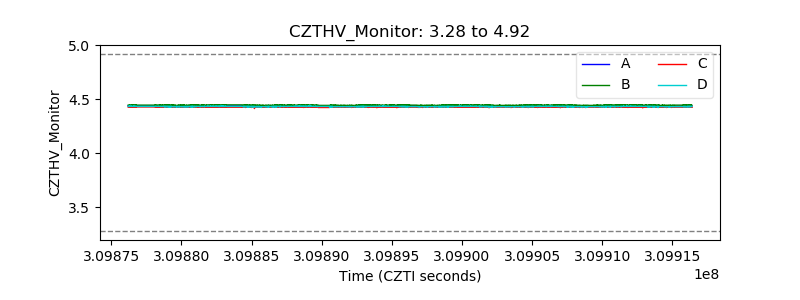 |
| D_VDD | 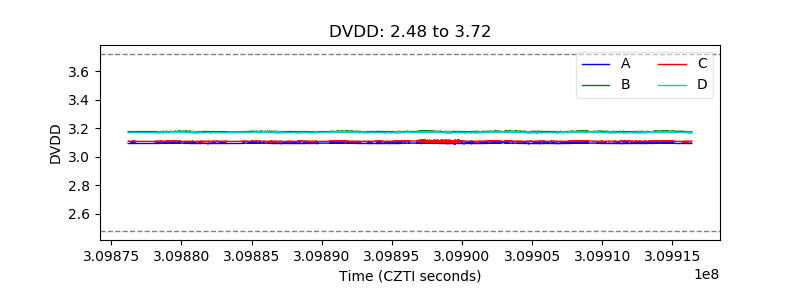 |
| Temperature 1 |  |
| Veto HV Monitor |  |
| Veto LLD |  |
| Alpha Counter |  |
| _CPM_Rate | 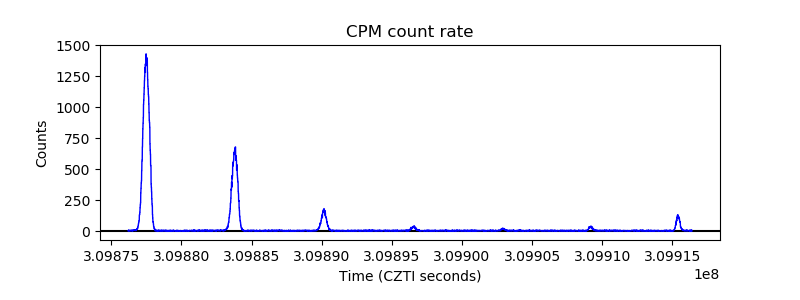 |
| CZT Counter |  |
| +2.5 Volts monitor |  |
| +5 Volts monitor |  |
| _ROLL_ROT |  |
| _Roll_DEC | 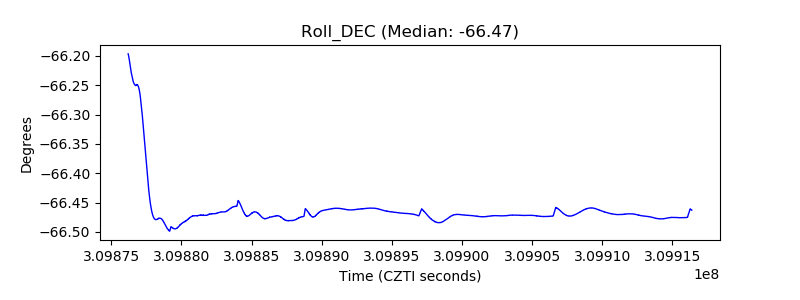 |
| _Roll_RA | 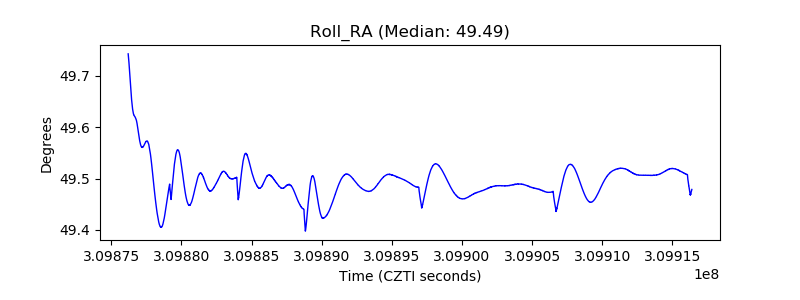 |
| Veto Counter |  |