| Param | Original file | Final file |
|---|---|---|
| Filename | modeM0/AS1A07_049T01_9000003298cztM0_level2_bc.evt | modeM0/AS1A07_049T01_9000003298cztM0_level2_quad_clean.evt |
| Size (bytes) | 1,580,149,440 | 649,137,600 |
| Size | 1.5 GB | 619.1 MB |
| Events in quadrant A | 10,631,578 | 4,150,299 |
| Events in quadrant B | 11,193,138 | 4,248,110 |
| Events in quadrant C | 10,234,528 | 3,997,235 |
| Events in quadrant D | 12,406,677 | 3,859,146 |
| Mode SS | |||
|---|---|---|---|
| Quadrant | BADHDUFLAG | Total packets | Discarded packets |
| A | 0 | 1014 | 0 |
| B | 0 | 1014 | 0 |
| C | 0 | 1014 | 0 |
| D | 0 | 1014 | 0 |
| Mode M9 | |||
|---|---|---|---|
| Quadrant | BADHDUFLAG | Total packets | Discarded packets |
| A | 0 | 93 | 0 |
| B | 0 | 94 | 0 |
| C | 0 | 94 | 0 |
| D | 0 | 94 | 0 |
| Mode M0 | |||
|---|---|---|---|
| Quadrant | BADHDUFLAG | Total packets | Discarded packets |
| A | 0 | 103003 | 0 |
| B | 0 | 104864 | 0 |
| C | 0 | 103461 | 0 |
| D | 0 | 108932 | 0 |
| Quadrant | Total seconds | Saturated seconds | Saturation percentage |
|---|---|---|---|
| A | 49646 | 516 | 1.039359% |
| B | 49646 | 667 | 1.343512% |
| C | 49646 | 763 | 1.536881% |
| D | 49646 | 800 | 1.611409% |
Noise dominated data is calculated using 1-second bins in cleaned event files. If a bin has >2000 counts, and if more than 50% of those come from <1% of pixels, then it is considered to be noise-dominated and hence unusable.
| Quadrant | # 1 sec bins | Bins with >0 counts | Bins with >2000 counts | High rate bins dominated by noise | Noise dominated (total time) | Noise dominated (detector-on time) | Marked lightcurve |
|---|---|---|---|---|---|---|---|
| A | 76477 | 49647 | 0 | 0 | 0.00% | 0.00% |  |
| B | 76477 | 49644 | 3 | 3 | 0.00% | 0.01% |  |
| C | 76477 | 49650 | 0 | 0 | 0.00% | 0.00% | 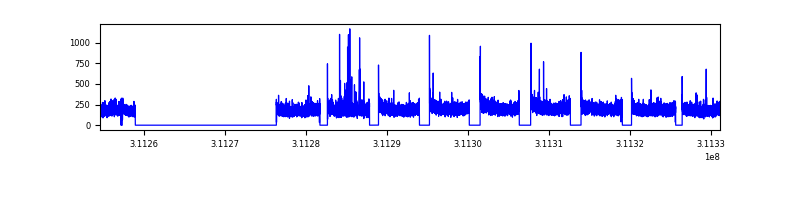 |
| D | 76477 | 49646 | 86 | 86 | 0.11% | 0.17% |  |
Top three noisy pixels from each quadrant. If the there are fewer than three noisy pixels in the level2.evt file, extra rows are filled as -1
| Pixel properties | Quadrant properties | ||||||
|---|---|---|---|---|---|---|---|
| Quadrant | DetID | PixID | Counts | Sigma | Mean | Median | Sigma |
| A | 13 | 254 | 59113 | 96.38 | 2750 | 2706 | 585.2 |
| A | 8 | 6 | 29073 | 45.05 | 2750 | 2706 | 585.2 |
| A | 0 | 226 | 17605 | 25.46 | 2750 | 2706 | 585.2 |
| B | 3 | 64 | 209729 | 399.02 | 2801 | 2740 | 518.7 |
| B | 0 | 190 | 120388 | 226.79 | 2801 | 2740 | 518.7 |
| B | 0 | 245 | 70303 | 130.24 | 2801 | 2740 | 518.7 |
| C | 10 | 1 | 34889 | 52.46 | 2641 | 2634 | 614.9 |
| C | 0 | 10 | 33259 | 49.8 | 2641 | 2634 | 614.9 |
| C | 13 | 61 | 15270 | 20.55 | 2641 | 2634 | 614.9 |
| D | 1 | 52 | 838223 | 1362.41 | 2669 | 2579 | 613.4 |
| D | 13 | 104 | 481741 | 781.21 | 2669 | 2579 | 613.4 |
| D | 2 | 136 | 255386 | 412.17 | 2669 | 2579 | 613.4 |
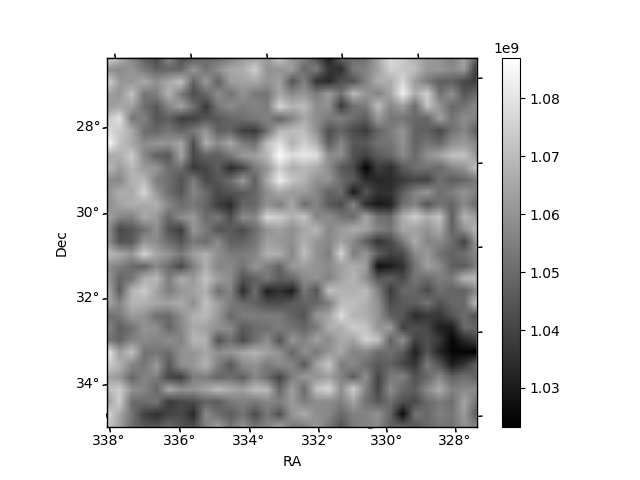
Histogram calculated using DETX and DETY for each event in the final _common_clean file
| Quadrant A | 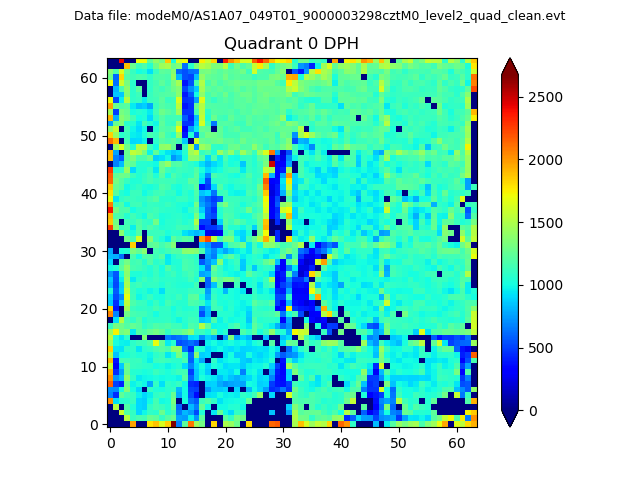 |
 |
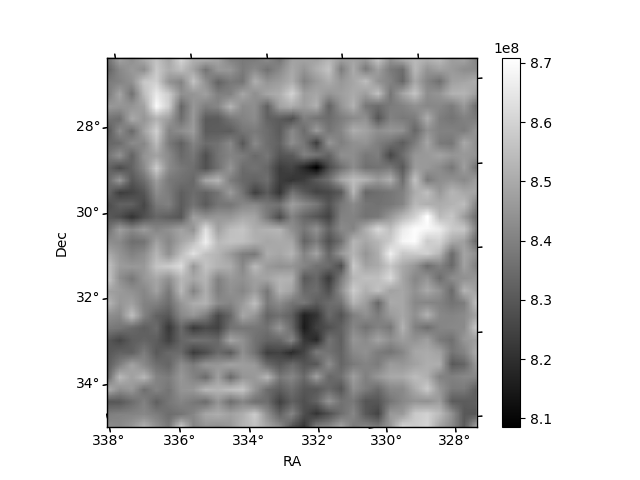
Quadrant B |
|---|---|---|---|
| Quadrant D |  |
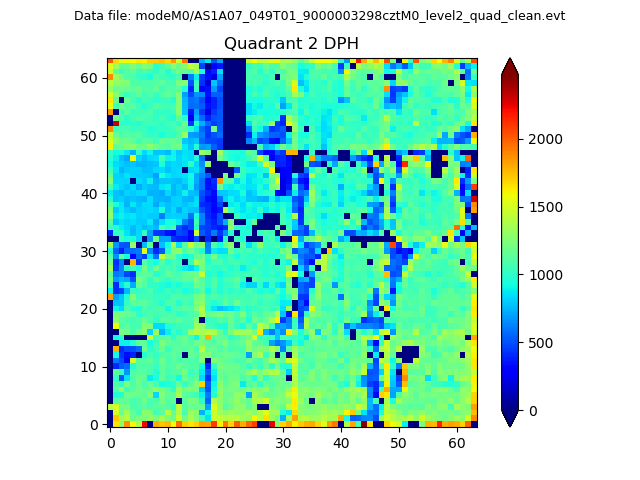 |
Quadrant C |
| Plot type | Count rate plots | Images |
|---|---|---|
| Comparison with Poisson distribution Blue bars denote a histogram of data divided into 1 sec bins. Red curve is a Poisson curve with rate = median count rate of data. |
 |
 |
| Quadrant-wise count rates Data is divided into 100 sec bins |
 |
|
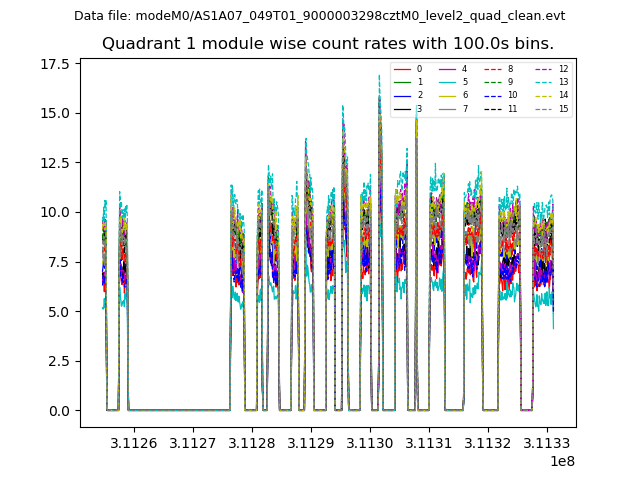
| Module-wise count rates for Quadrant A Data is divided into 100 sec bins |
 |
 |
| Module-wise count rates for Quadrant B Data is divided into 100 sec bins |
 |
 |
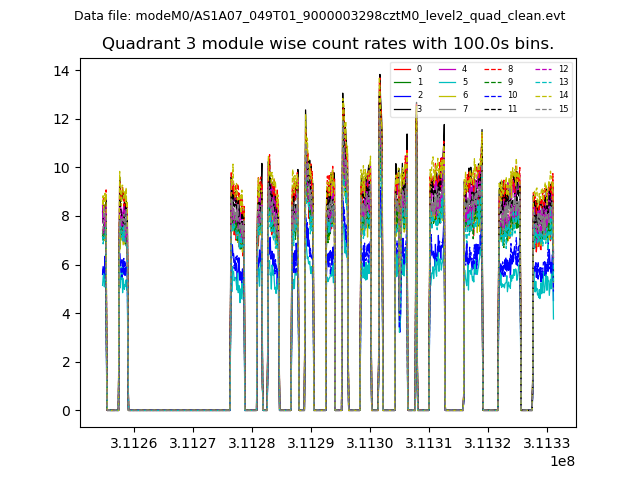
| Module-wise count rates for Quadrant C Data is divided into 100 sec bins |
 |
 |
| Module-wise count rates for Quadrant D Data is divided into 100 sec bins |
 |
 |
| Parameter | Plot |
|---|---|
| CZT HV Monitor |  |
| D_VDD | 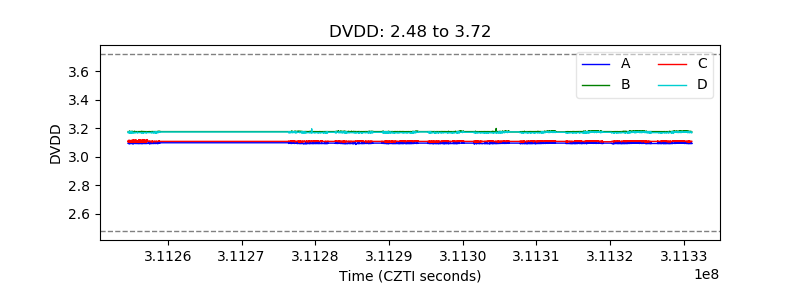 |
| Temperature 1 | 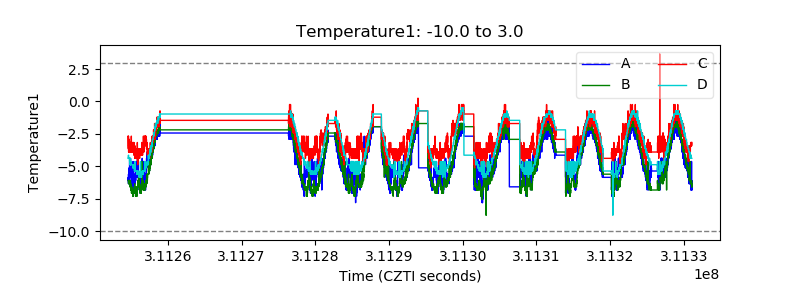 |
| Veto HV Monitor |  |
| Veto LLD |  |
| Alpha Counter |  |
| _CPM_Rate |  |
| CZT Counter |  |
| +2.5 Volts monitor |  |
| +5 Volts monitor |  |
| _ROLL_ROT |  |
| _Roll_DEC |  |
| _Roll_RA |  |
| Veto Counter |  |