| Param | Original file | Final file |
|---|---|---|
| Filename | modeM0/AS1A07_148T05_9000003346cztM0_level2_bc.evt | modeM0/AS1A07_148T05_9000003346cztM0_level2_quad_clean.evt |
| Size (bytes) | 4,095,146,880 | 1,515,741,120 |
| Size | 3.8 GB | 1.4 GB |
| Events in quadrant A | 25,818,138 | 9,548,478 |
| Events in quadrant B | 27,457,567 | 9,721,000 |
| Events in quadrant C | 25,580,114 | 9,406,243 |
| Events in quadrant D | 37,042,171 | 9,063,697 |
| Mode M9 | |||
|---|---|---|---|
| Quadrant | BADHDUFLAG | Total packets | Discarded packets |
| A | 0 | 212 | 0 |
| B | 0 | 212 | 0 |
| C | 0 | 212 | 0 |
| D | 0 | 212 | 0 |
| Mode M0 | |||
|---|---|---|---|
| Quadrant | BADHDUFLAG | Total packets | Discarded packets |
| A | 0 | 251351 | 0 |
| B | 0 | 259653 | 0 |
| C | 0 | 254598 | 0 |
| D | 0 | 293364 | 0 |
| Mode SS | |||
|---|---|---|---|
| Quadrant | BADHDUFLAG | Total packets | Discarded packets |
| A | 0 | 2420 | 0 |
| B | 0 | 2420 | 0 |
| C | 0 | 2420 | 0 |
| D | 0 | 2420 | 0 |
| Quadrant | Total seconds | Saturated seconds | Saturation percentage |
|---|---|---|---|
| A | 119278 | 1340 | 1.123426% |
| B | 119278 | 1888 | 1.582857% |
| C | 119278 | 2187 | 1.833532% |
| D | 119278 | 4165 | 3.491843% |
Noise dominated data is calculated using 1-second bins in cleaned event files. If a bin has >2000 counts, and if more than 50% of those come from <1% of pixels, then it is considered to be noise-dominated and hence unusable.
| Quadrant | # 1 sec bins | Bins with >0 counts | Bins with >2000 counts | High rate bins dominated by noise | Noise dominated (total time) | Noise dominated (detector-on time) | Marked lightcurve |
|---|---|---|---|---|---|---|---|
| A | 139911 | 119276 | 0 | 0 | 0.00% | 0.00% |  |
| B | 139911 | 119275 | 19 | 19 | 0.01% | 0.02% |  |
| C | 139911 | 119274 | 5 | 5 | 0.00% | 0.00% |  |
| D | 139911 | 119277 | 801 | 801 | 0.57% | 0.67% |  |
Top three noisy pixels from each quadrant. If the there are fewer than three noisy pixels in the level2.evt file, extra rows are filled as -1
| Pixel properties | Quadrant properties | ||||||
|---|---|---|---|---|---|---|---|
| Quadrant | DetID | PixID | Counts | Sigma | Mean | Median | Sigma |
| A | 13 | 34 | 287334 | 198.92 | 6580 | 6461 | 1412.0 |
| A | 13 | 254 | 188104 | 128.64 | 6580 | 6461 | 1412.0 |
| A | 4 | 2 | 108767 | 72.46 | 6580 | 6461 | 1412.0 |
| B | 15 | 33 | 1178356 | 953.29 | 6627 | 6466 | 1229.3 |
| B | 5 | 172 | 228103 | 180.29 | 6627 | 6466 | 1229.3 |
| B | 0 | 190 | 183901 | 144.34 | 6627 | 6466 | 1229.3 |
| C | 0 | 207 | 650134 | 430.91 | 6410 | 6397 | 1493.9 |
| C | 10 | 22 | 147561 | 94.49 | 6410 | 6397 | 1493.9 |
| C | 0 | 10 | 131132 | 83.5 | 6410 | 6397 | 1493.9 |
| D | 1 | 52 | 6332974 | 4257.46 | 6466 | 6251 | 1486.0 |
| D | 7 | 223 | 2722943 | 1828.15 | 6466 | 6251 | 1486.0 |
| D | 12 | 33 | 1076081 | 719.92 | 6466 | 6251 | 1486.0 |
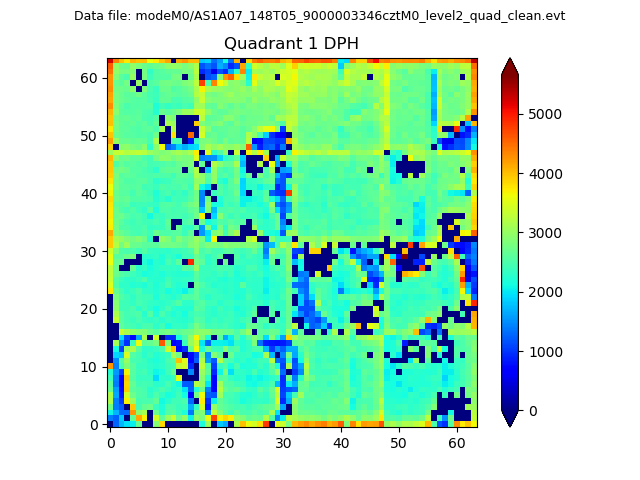
Histogram calculated using DETX and DETY for each event in the final _common_clean file
| Quadrant A |  |
 |
Quadrant B |
|---|---|---|---|
| Quadrant D | 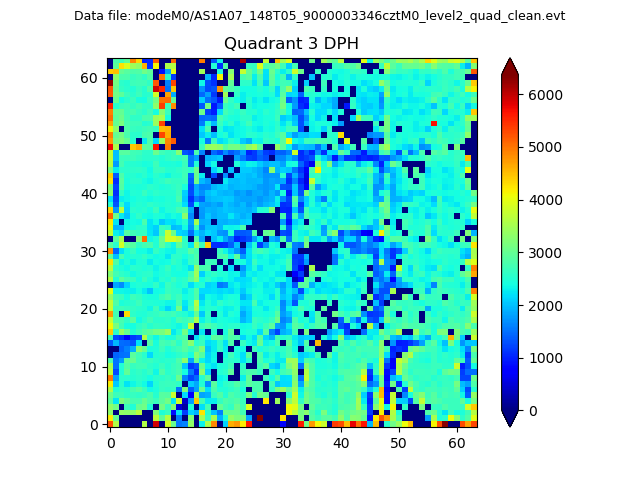 |
 |
Quadrant C |
| Plot type | Count rate plots | Images |
|---|---|---|
| Comparison with Poisson distribution Blue bars denote a histogram of data divided into 1 sec bins. Red curve is a Poisson curve with rate = median count rate of data. |
 |
 |
| Quadrant-wise count rates Data is divided into 100 sec bins |
 |
|
| Module-wise count rates for Quadrant A Data is divided into 100 sec bins |
 |
 |
| Module-wise count rates for Quadrant B Data is divided into 100 sec bins |
 |
 |
| Module-wise count rates for Quadrant C Data is divided into 100 sec bins |
 |
 |
| Module-wise count rates for Quadrant D Data is divided into 100 sec bins |
 |
 |
| Parameter | Plot |
|---|---|
| CZT HV Monitor |  |
| D_VDD | 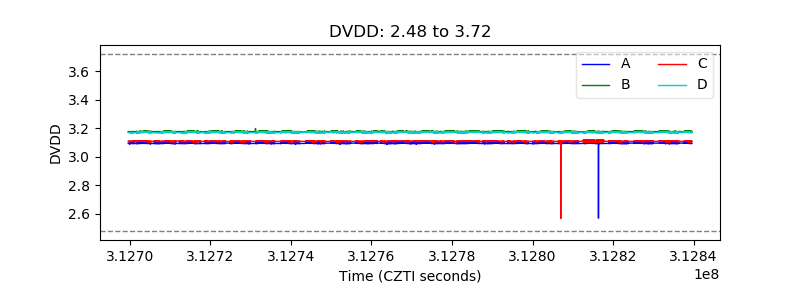 |
| Temperature 1 |  |
| Veto HV Monitor |  |
| Veto LLD |  |
| Alpha Counter |  |
| _CPM_Rate |  |
| CZT Counter |  |
| +2.5 Volts monitor |  |
| +5 Volts monitor |  |
| _ROLL_ROT |  |
| _Roll_DEC |  |
| _Roll_RA |  |
| Veto Counter |  |