| Param | Original file | Final file |
|---|---|---|
| Filename | modeM0/AS1A07_047T08_9000003384cztM0_level2_bc.evt | modeM0/AS1A07_047T08_9000003384cztM0_level2_quad_clean.evt |
| Size (bytes) | 352,880,640 | 147,072,960 |
| Size | 336.5 MB | 140.3 MB |
| Events in quadrant A | 1,829,748 | 987,252 |
| Events in quadrant B | 1,957,216 | 991,345 |
| Events in quadrant C | 1,727,701 | 946,810 |
| Events in quadrant D | 4,552,183 | 904,605 |
| Mode SS | |||
|---|---|---|---|
| Quadrant | BADHDUFLAG | Total packets | Discarded packets |
| A | 0 | 182 | 0 |
| B | 0 | 182 | 0 |
| C | 0 | 182 | 0 |
| D | 0 | 182 | 0 |
| Mode M0 | |||
|---|---|---|---|
| Quadrant | BADHDUFLAG | Total packets | Discarded packets |
| A | 0 | 18614 | 0 |
| B | 0 | 18800 | 0 |
| C | 0 | 18436 | 0 |
| D | 0 | 28049 | 0 |
| Mode M9 | |||
|---|---|---|---|
| Quadrant | BADHDUFLAG | Total packets | Discarded packets |
| A | 0 | 1 | 0 |
| B | 0 | 1 | 0 |
| C | 0 | 1 | 0 |
| D | 0 | 1 | 0 |
| Quadrant | Total seconds | Saturated seconds | Saturation percentage |
|---|---|---|---|
| A | 8994 | 155 | 1.723371% |
| B | 8994 | 181 | 2.012453% |
| C | 8994 | 177 | 1.967979% |
| D | 8994 | 548 | 6.092951% |
Noise dominated data is calculated using 1-second bins in cleaned event files. If a bin has >2000 counts, and if more than 50% of those come from <1% of pixels, then it is considered to be noise-dominated and hence unusable.
| Quadrant | # 1 sec bins | Bins with >0 counts | Bins with >2000 counts | High rate bins dominated by noise | Noise dominated (total time) | Noise dominated (detector-on time) | Marked lightcurve |
|---|---|---|---|---|---|---|---|
| A | 9159 | 8994 | 0 | 0 | 0.00% | 0.00% | 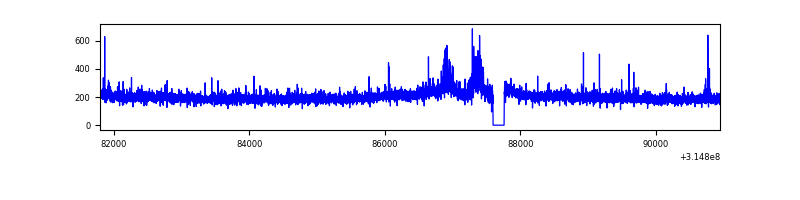 |
| B | 9159 | 8995 | 3 | 3 | 0.03% | 0.03% | 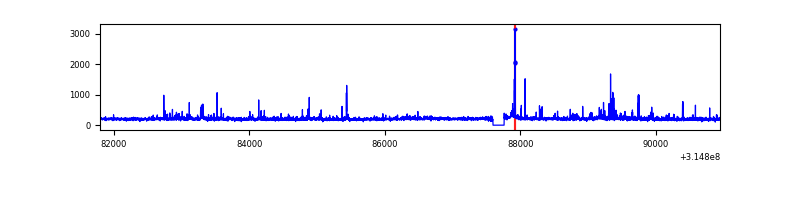 |
| C | 9159 | 8995 | 0 | 0 | 0.00% | 0.00% | 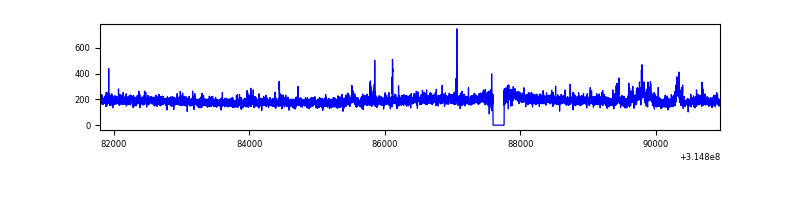 |
| D | 9159 | 8994 | 33 | 33 | 0.36% | 0.37% | 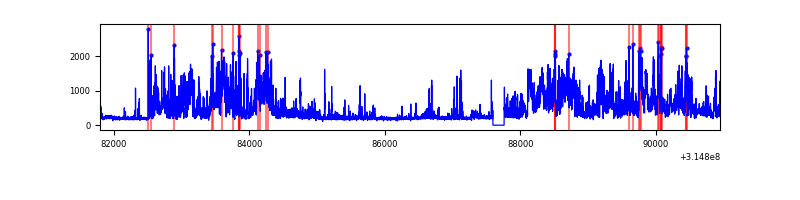 |
Top three noisy pixels from each quadrant. If the there are fewer than three noisy pixels in the level2.evt file, extra rows are filled as -1
| Pixel properties | Quadrant properties | ||||||
|---|---|---|---|---|---|---|---|
| Quadrant | DetID | PixID | Counts | Sigma | Mean | Median | Sigma |
| A | 13 | 252 | 60294 | 583.84 | 449 | 439 | 102.5 |
| A | 0 | 23 | 22333 | 213.56 | 449 | 439 | 102.5 |
| A | 13 | 254 | 15258 | 144.55 | 449 | 439 | 102.5 |
| B | 3 | 64 | 70607 | 782.02 | 450 | 438 | 89.7 |
| B | 0 | 190 | 48684 | 537.69 | 450 | 438 | 89.7 |
| B | 0 | 228 | 30238 | 332.11 | 450 | 438 | 89.7 |
| C | 6 | 80 | 57687 | 555.18 | 427 | 423 | 103.1 |
| C | 7 | 247 | 8034 | 73.79 | 427 | 423 | 103.1 |
| C | 8 | 128 | 5471 | 48.94 | 427 | 423 | 103.1 |
| D | 13 | 172 | 1690220 | 16305.95 | 430 | 414 | 103.6 |
| D | 1 | 52 | 459126 | 4426.39 | 430 | 414 | 103.6 |
| D | 1 | 239 | 276916 | 2668.13 | 430 | 414 | 103.6 |
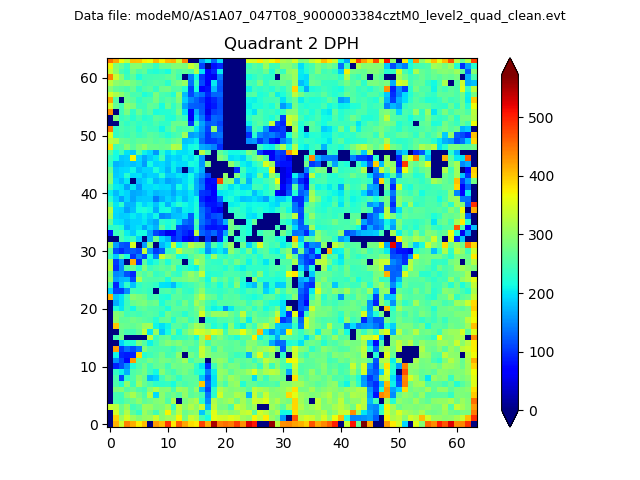
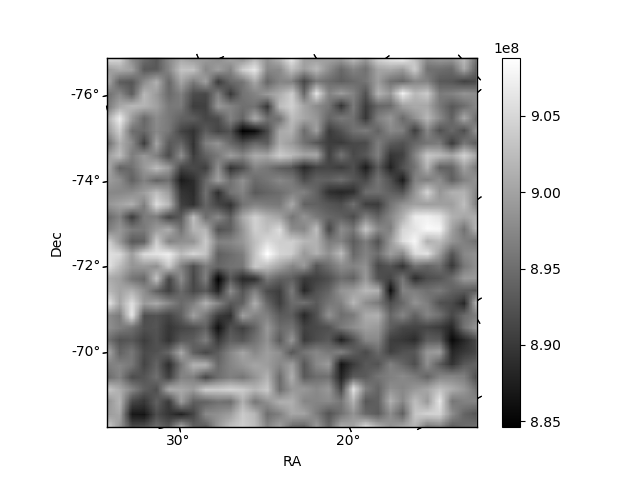
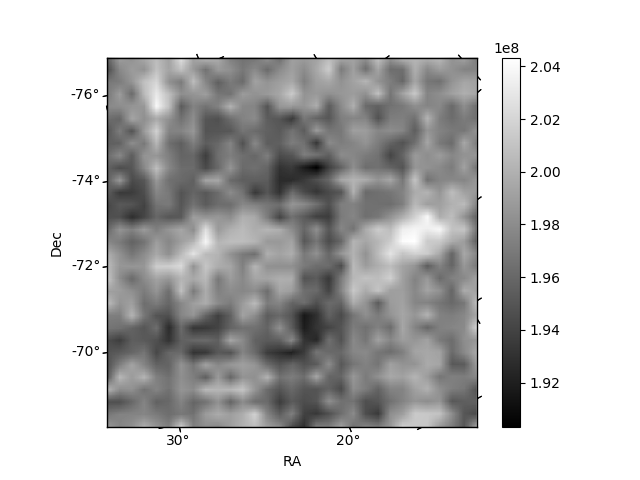
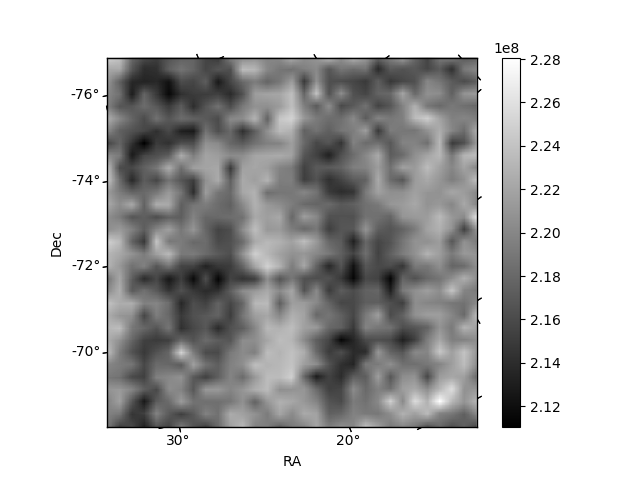
Histogram calculated using DETX and DETY for each event in the final _common_clean file
| Quadrant A | 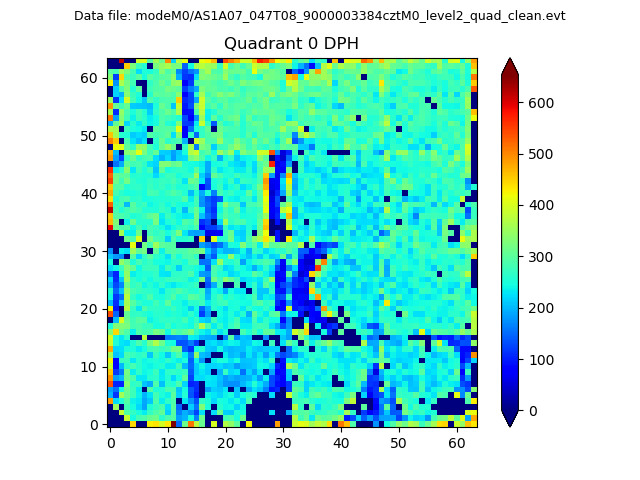 |
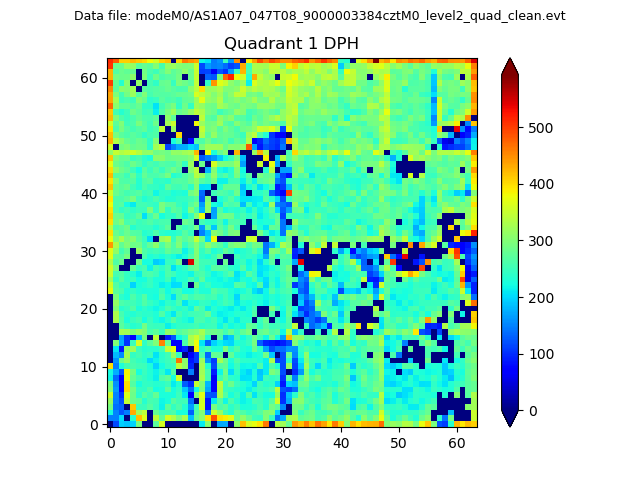 |
Quadrant B |
|---|---|---|---|
| Quadrant D | 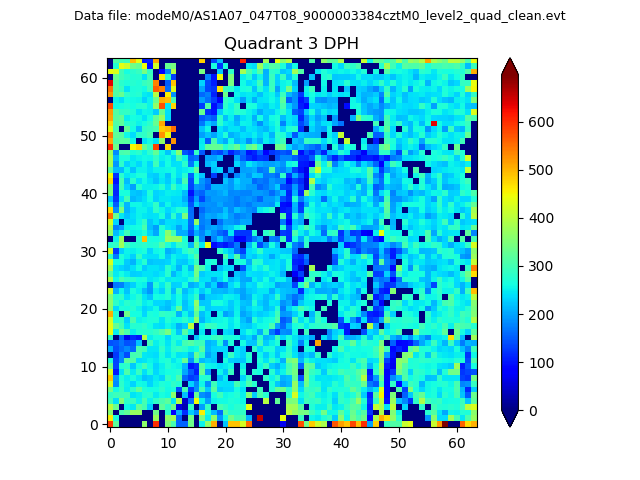 |
 |
Quadrant C |
| Plot type | Count rate plots | Images |
|---|---|---|
| Comparison with Poisson distribution Blue bars denote a histogram of data divided into 1 sec bins. Red curve is a Poisson curve with rate = median count rate of data. |
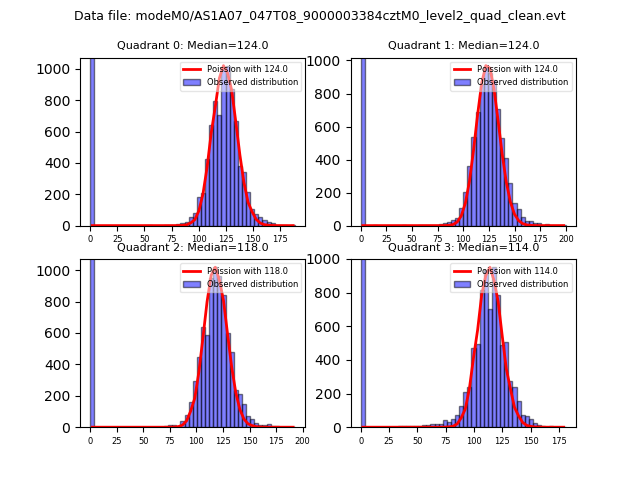 |
 |
| Quadrant-wise count rates Data is divided into 100 sec bins |
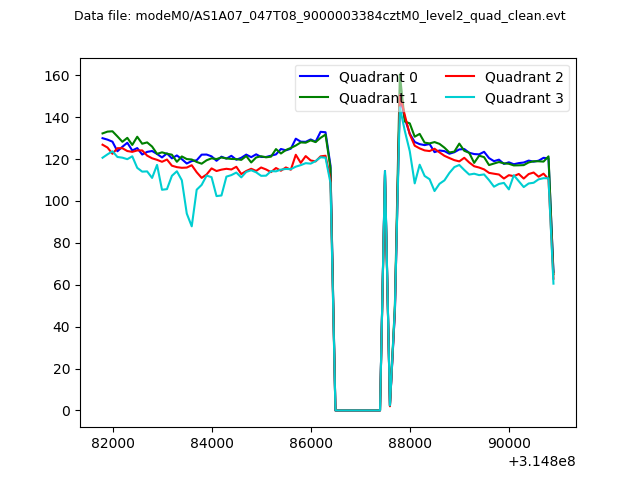 |
|
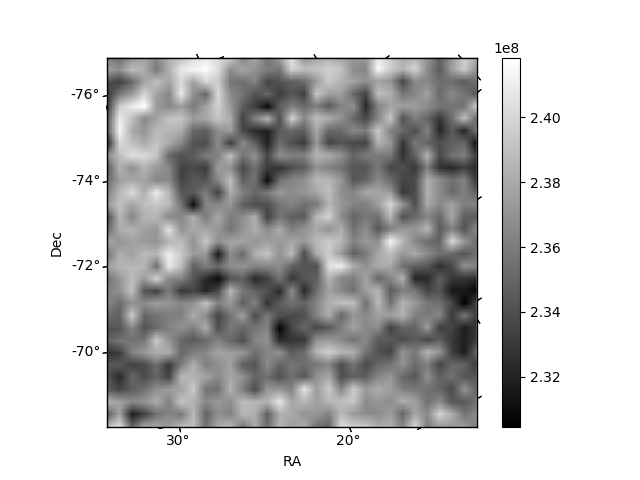
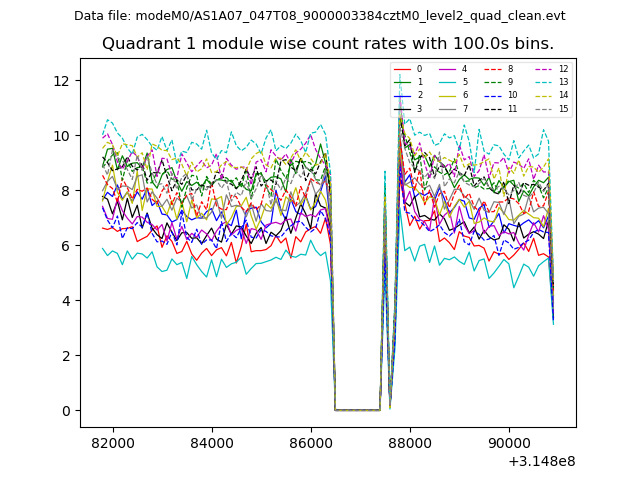
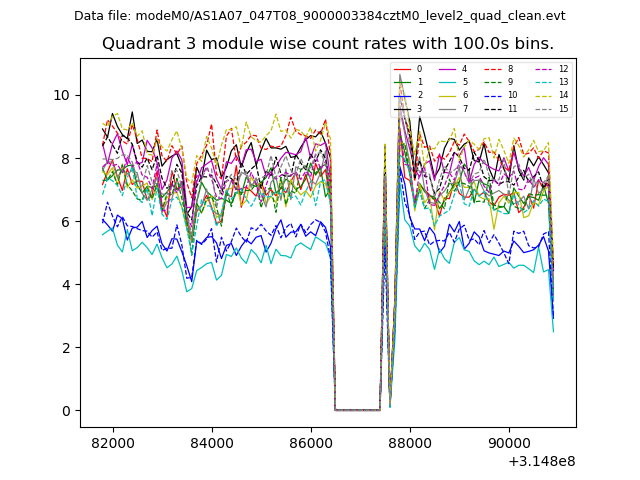
| Module-wise count rates for Quadrant A Data is divided into 100 sec bins |
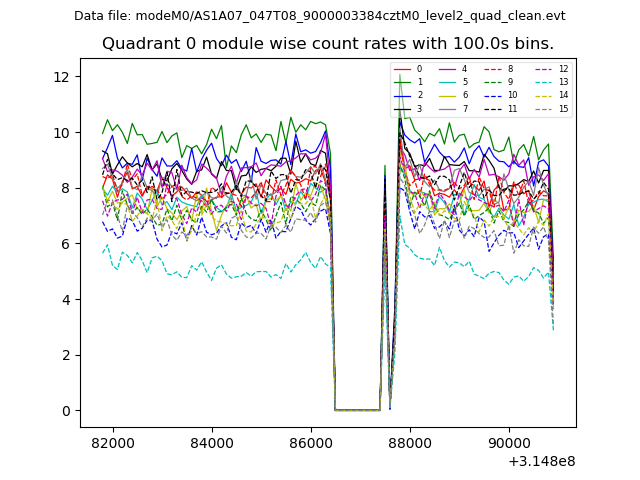 |
 |
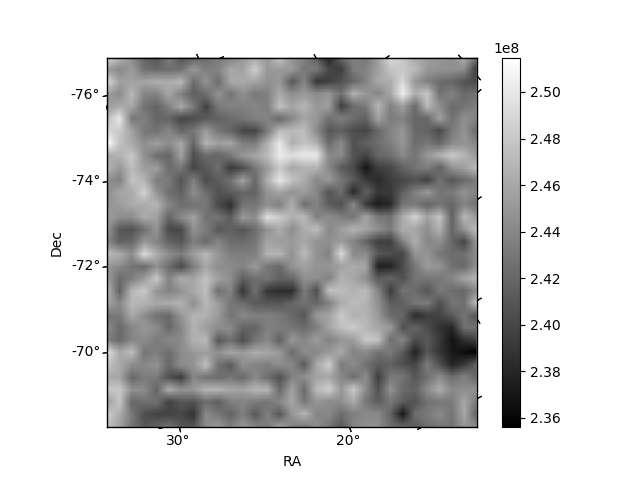
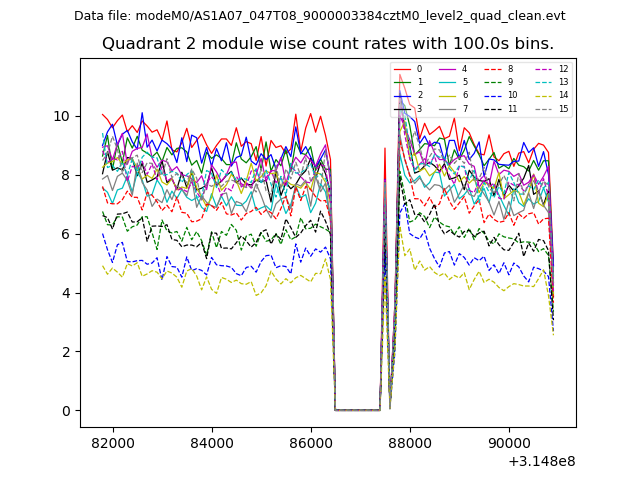
| Module-wise count rates for Quadrant B Data is divided into 100 sec bins |
 |
 |
| Module-wise count rates for Quadrant C Data is divided into 100 sec bins |
 |
 |
| Module-wise count rates for Quadrant D Data is divided into 100 sec bins |
 |
 |
| Parameter | Plot |
|---|---|
| CZT HV Monitor | 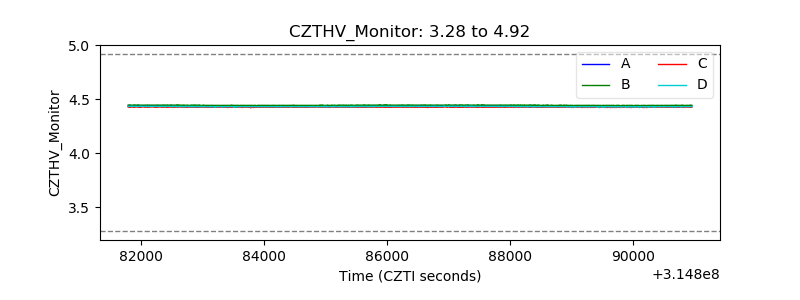 |
| D_VDD | 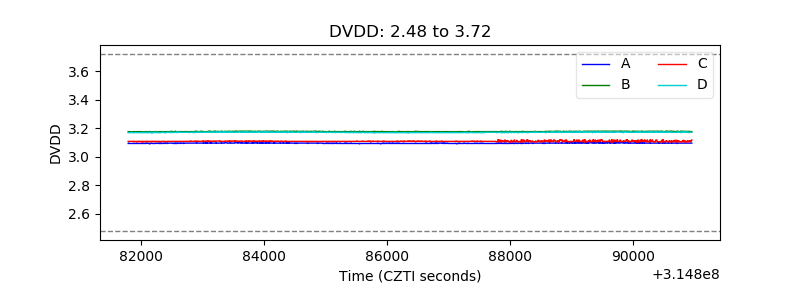 |
| Temperature 1 | 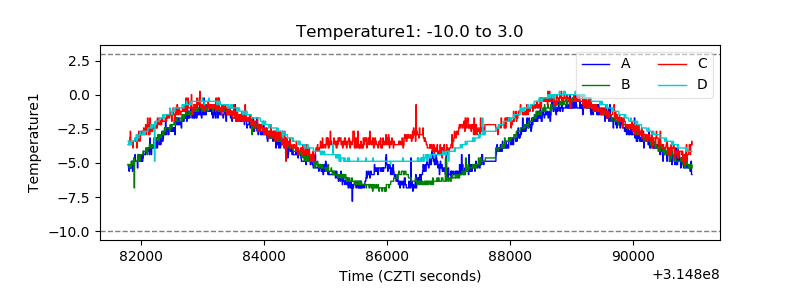 |
| Veto HV Monitor | 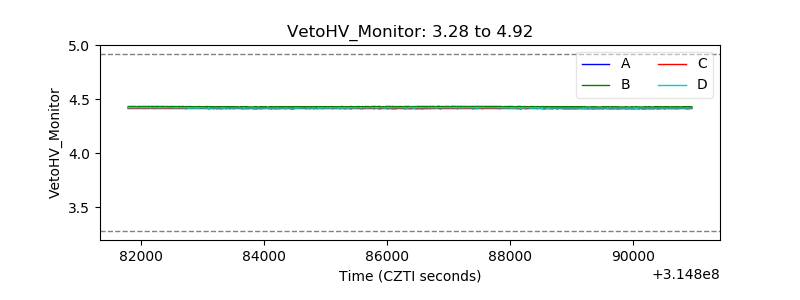 |
| Veto LLD | 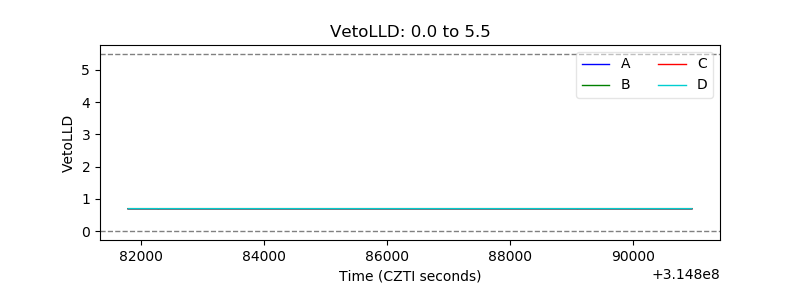 |
| Alpha Counter | 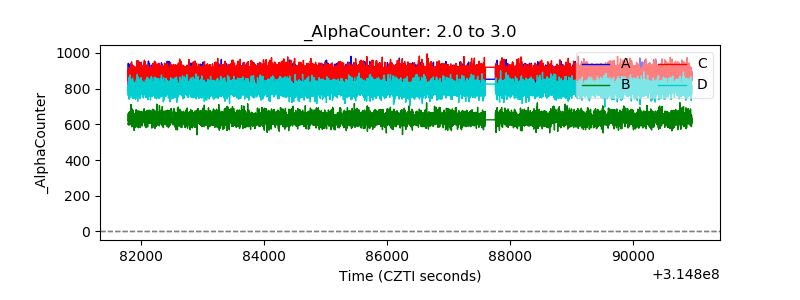 |
| _CPM_Rate | 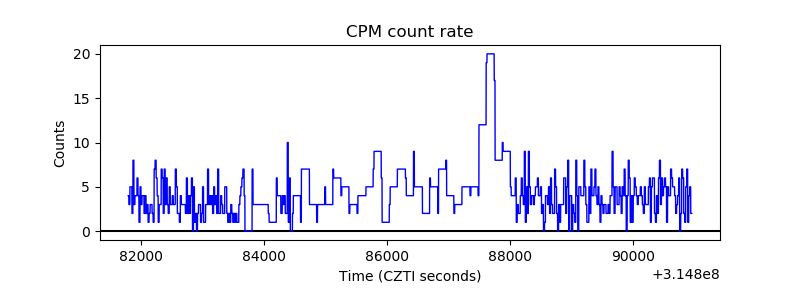 |
| CZT Counter | 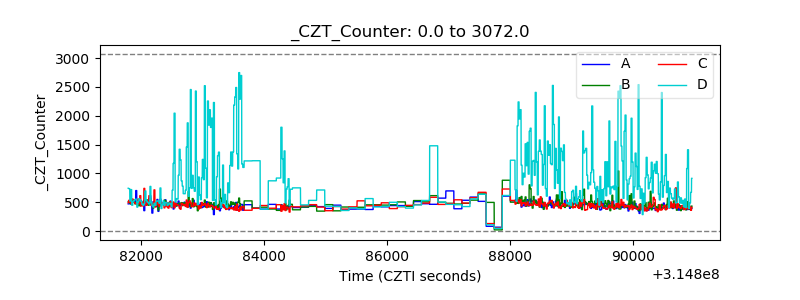 |
| +2.5 Volts monitor | 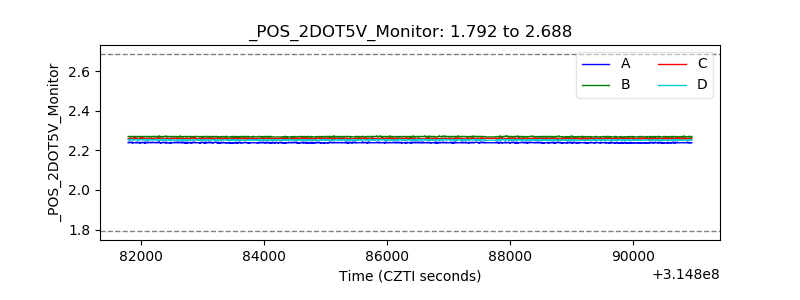 |
| +5 Volts monitor | 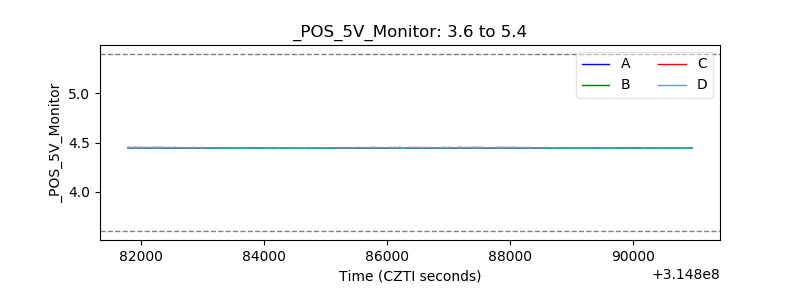 |
| _ROLL_ROT | 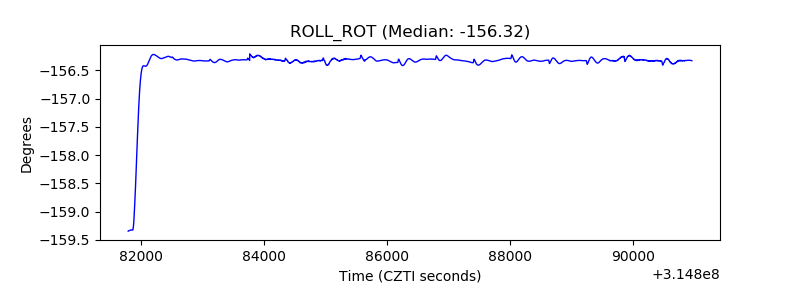 |
| _Roll_DEC | 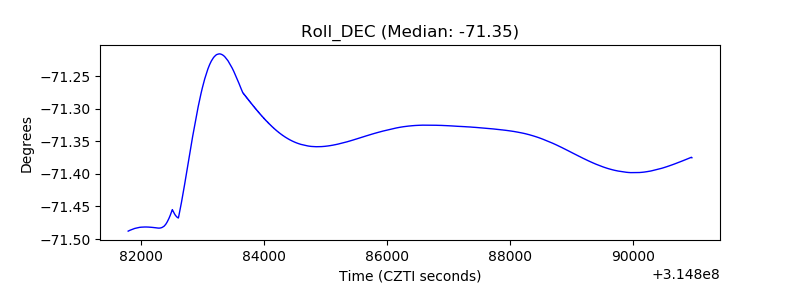 |
| _Roll_RA | 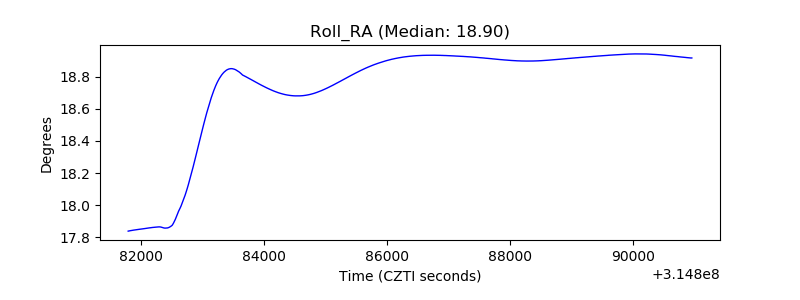 |
| Veto Counter | 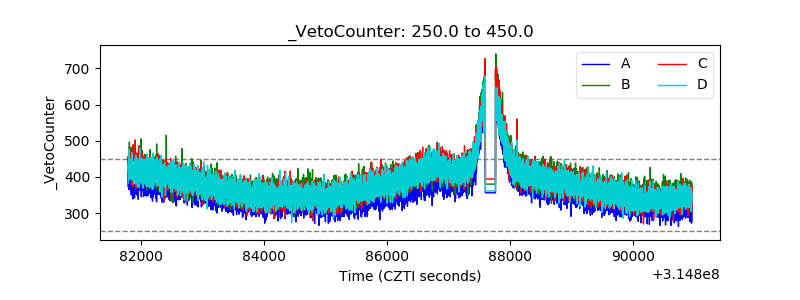 |