| Param | Original file | Final file |
|---|---|---|
| Filename | modeM0/AS1A08_008T01_9000003414cztM0_level2_bc.evt | modeM0/AS1A08_008T01_9000003414cztM0_level2_quad_clean.evt |
| Size (bytes) | 3,805,574,400 | 1,472,898,240 |
| Size | 3.5 GB | 1.4 GB |
| Events in quadrant A | 47,159,132 | 9,519,664 |
| Events in quadrant B | 17,508,990 | 10,460,910 |
| Events in quadrant C | 20,391,084 | 9,778,034 |
| Events in quadrant D | 24,890,980 | 9,511,357 |
| Mode M0 | |||
|---|---|---|---|
| Quadrant | BADHDUFLAG | Total packets | Discarded packets |
| A | 0 | 253922 | 0 |
| B | 0 | 165880 | 0 |
| C | 0 | 176299 | 0 |
| D | 0 | 192240 | 0 |
| Mode M9 | |||
|---|---|---|---|
| Quadrant | BADHDUFLAG | Total packets | Discarded packets |
| A | 0 | 130 | 0 |
| B | 0 | 130 | 0 |
| C | 0 | 130 | 0 |
| D | 0 | 130 | 0 |
| Mode SS | |||
|---|---|---|---|
| Quadrant | BADHDUFLAG | Total packets | Discarded packets |
| A | 0 | 1592 | 0 |
| B | 0 | 1592 | 0 |
| C | 0 | 1592 | 0 |
| D | 0 | 1592 | 0 |
| Quadrant | Total seconds | Saturated seconds | Saturation percentage |
|---|---|---|---|
| A | 77906 | 11065 | 14.203014% |
| B | 77906 | 1441 | 1.849665% |
| C | 77906 | 2560 | 3.286011% |
| D | 77906 | 3091 | 3.967602% |
Noise dominated data is calculated using 1-second bins in cleaned event files. If a bin has >2000 counts, and if more than 50% of those come from <1% of pixels, then it is considered to be noise-dominated and hence unusable.
| Quadrant | # 1 sec bins | Bins with >0 counts | Bins with >2000 counts | High rate bins dominated by noise | Noise dominated (total time) | Noise dominated (detector-on time) | Marked lightcurve |
|---|---|---|---|---|---|---|---|
| A | 91086 | 77899 | 6586 | 6586 | 7.23% | 8.45% | 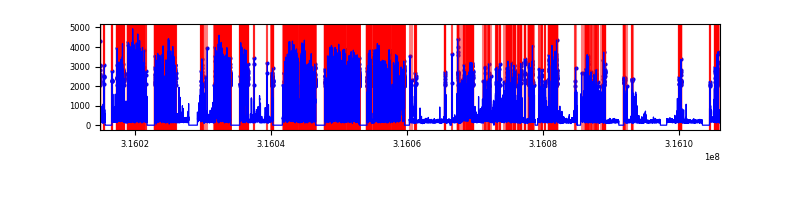 |
| B | 91086 | 77900 | 21 | 21 | 0.02% | 0.03% | 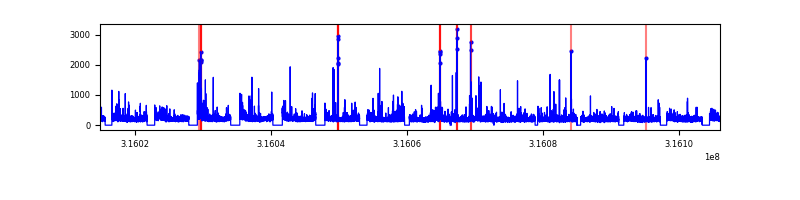 |
| C | 91085 | 77901 | 531 | 531 | 0.58% | 0.68% | 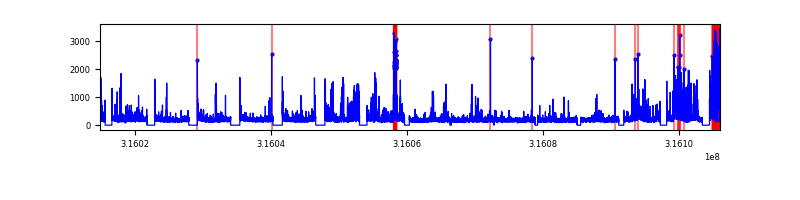 |
| D | 91086 | 77902 | 407 | 407 | 0.45% | 0.52% | 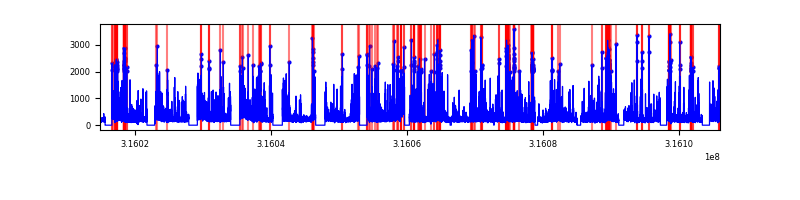 |
Top three noisy pixels from each quadrant. If the there are fewer than three noisy pixels in the level2.evt file, extra rows are filled as -1
| Pixel properties | Quadrant properties | ||||||
|---|---|---|---|---|---|---|---|
| Quadrant | DetID | PixID | Counts | Sigma | Mean | Median | Sigma |
| A | 6 | 16 | 32153458 | 37810.71 | 3877 | 3810 | 850.3 |
| A | 13 | 254 | 113386 | 128.87 | 3877 | 3810 | 850.3 |
| A | 4 | 2 | 42099 | 45.03 | 3877 | 3810 | 850.3 |
| B | 0 | 190 | 462876 | 586.39 | 4177 | 4082 | 782.4 |
| B | 0 | 189 | 403836 | 510.93 | 4177 | 4082 | 782.4 |
| B | 0 | 228 | 152177 | 189.28 | 4177 | 4082 | 782.4 |
| C | 8 | 208 | 2858673 | 3070.06 | 3918 | 3900 | 929.9 |
| C | 9 | 15 | 705929 | 754.97 | 3918 | 3900 | 929.9 |
| C | 0 | 207 | 697927 | 746.37 | 3918 | 3900 | 929.9 |
| D | 12 | 233 | 3001406 | 3216.64 | 3975 | 3844 | 931.9 |
| D | 1 | 52 | 2810444 | 3011.72 | 3975 | 3844 | 931.9 |
| D | 7 | 38 | 1012499 | 1082.37 | 3975 | 3844 | 931.9 |
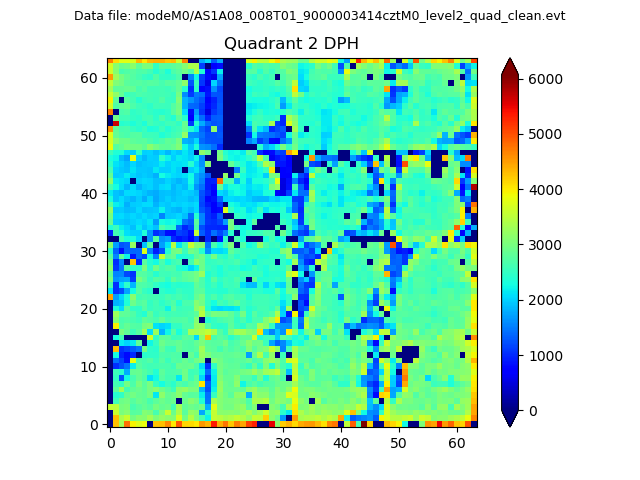
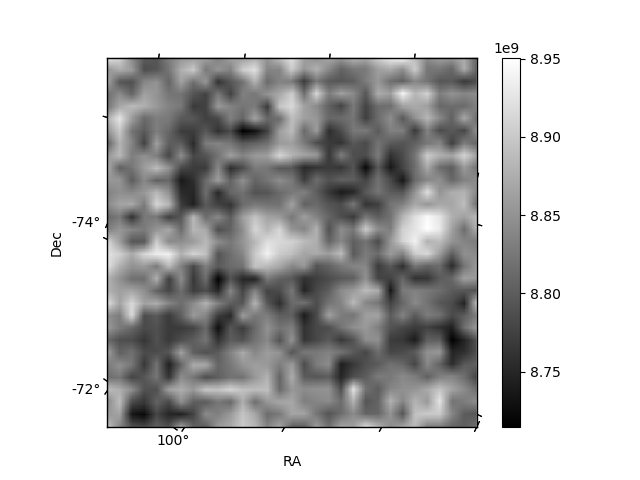
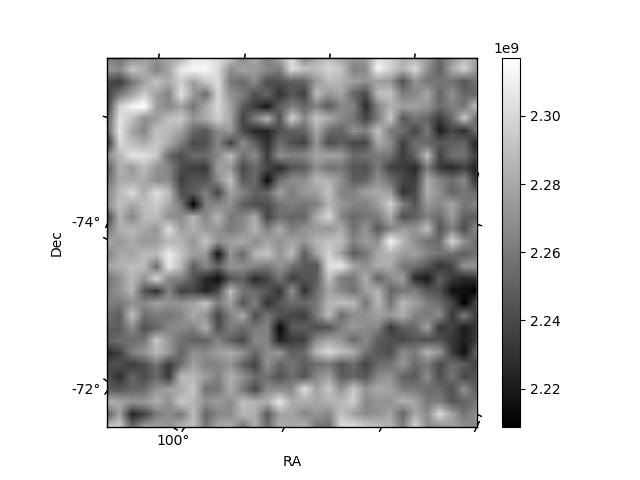
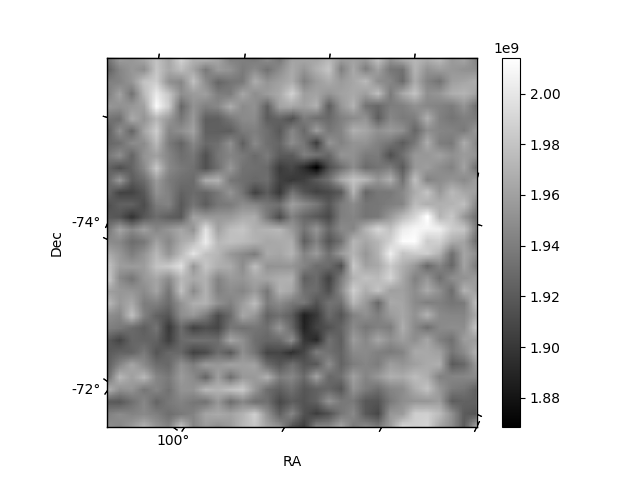
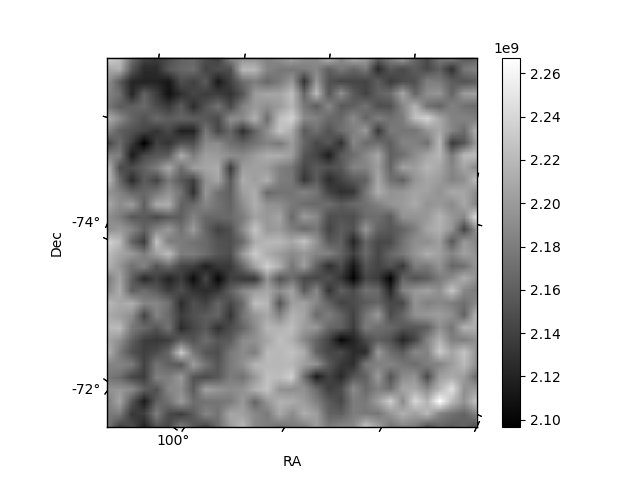
Histogram calculated using DETX and DETY for each event in the final _common_clean file
| Quadrant A | 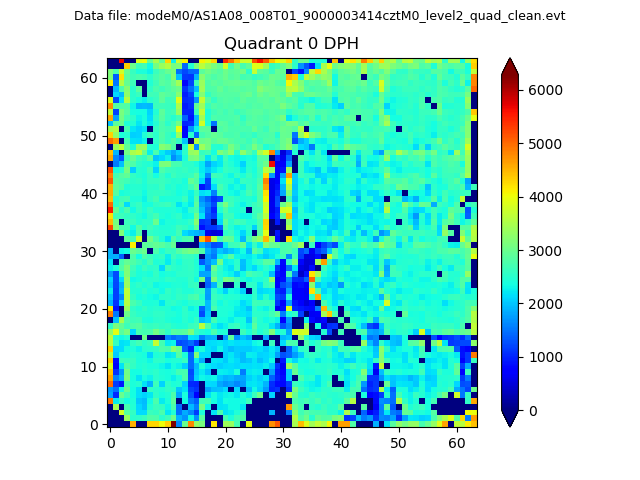 |
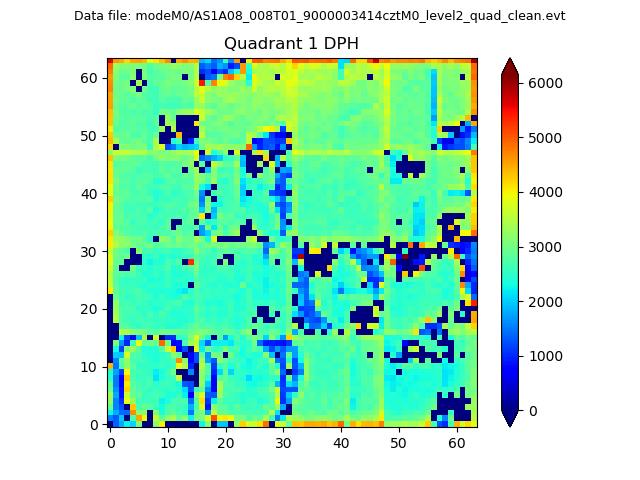 |
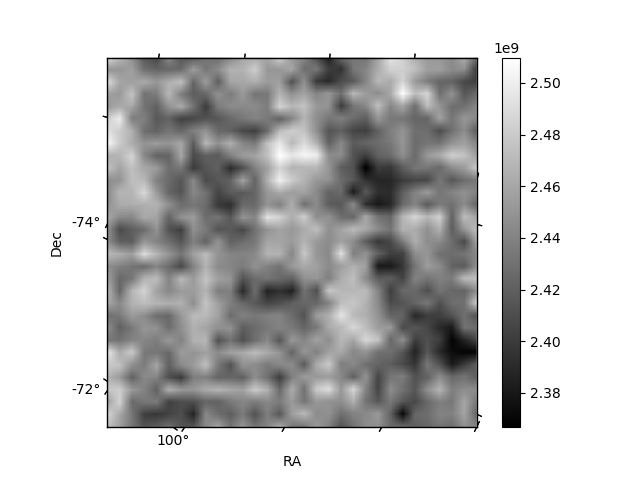
Quadrant B |
|---|---|---|---|
| Quadrant D | 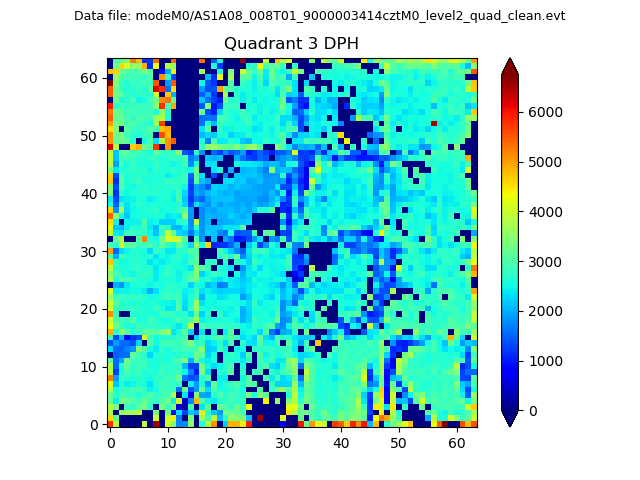 |
 |
Quadrant C |
| Plot type | Count rate plots | Images |
|---|---|---|
| Comparison with Poisson distribution Blue bars denote a histogram of data divided into 1 sec bins. Red curve is a Poisson curve with rate = median count rate of data. |
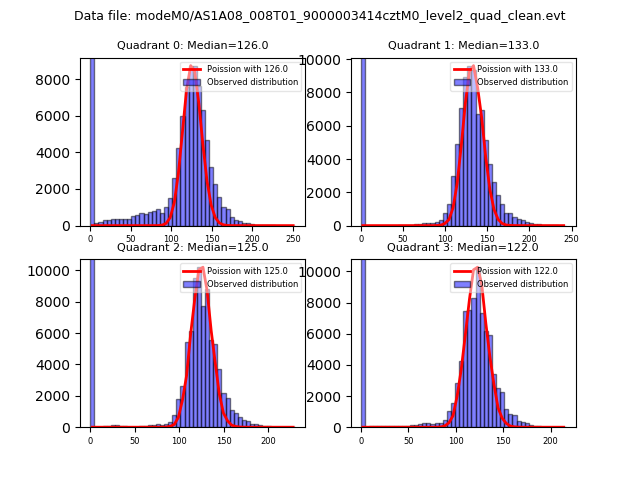 |
 |
| Quadrant-wise count rates Data is divided into 100 sec bins |
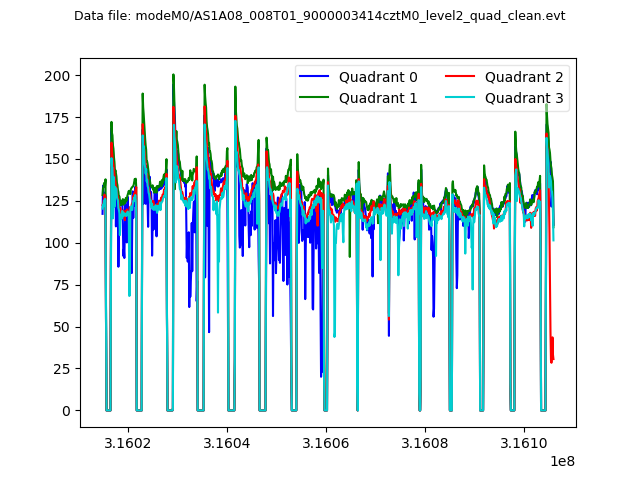 |
|
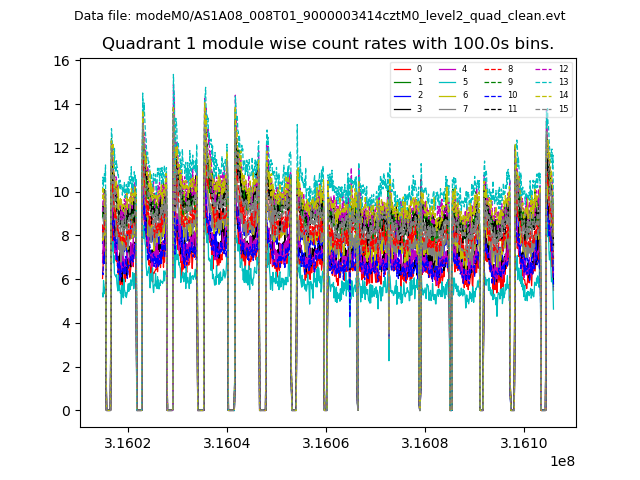
| Module-wise count rates for Quadrant A Data is divided into 100 sec bins |
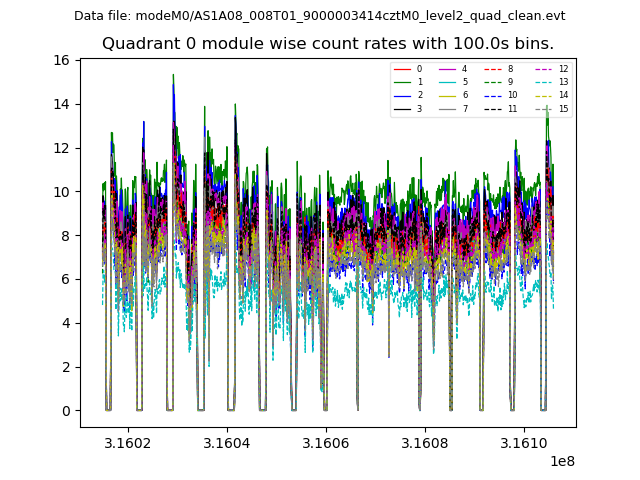 |
 |
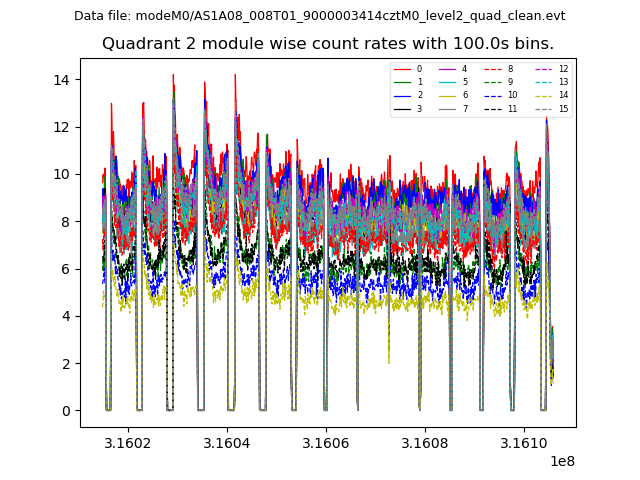
| Module-wise count rates for Quadrant B Data is divided into 100 sec bins |
 |
 |
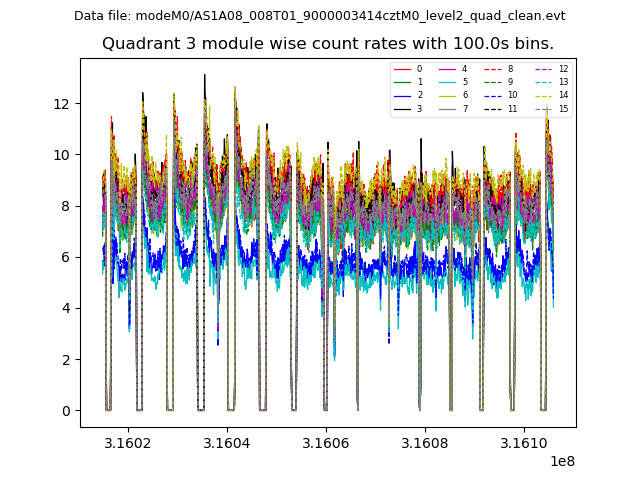
| Module-wise count rates for Quadrant C Data is divided into 100 sec bins |
 |
 |
| Module-wise count rates for Quadrant D Data is divided into 100 sec bins |
 |
 |
| Parameter | Plot |
|---|---|
| CZT HV Monitor | 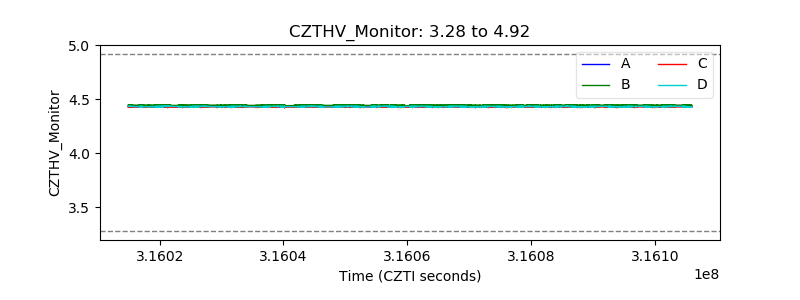 |
| D_VDD | 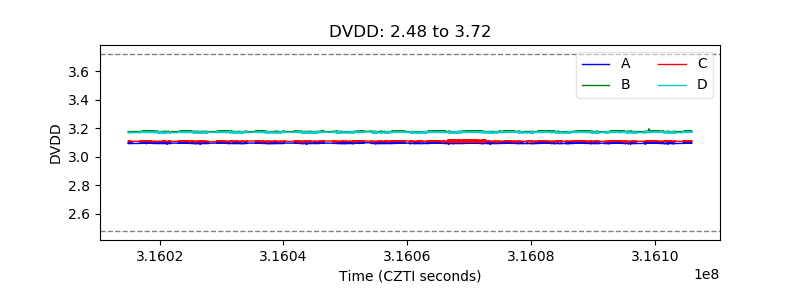 |
| Temperature 1 | 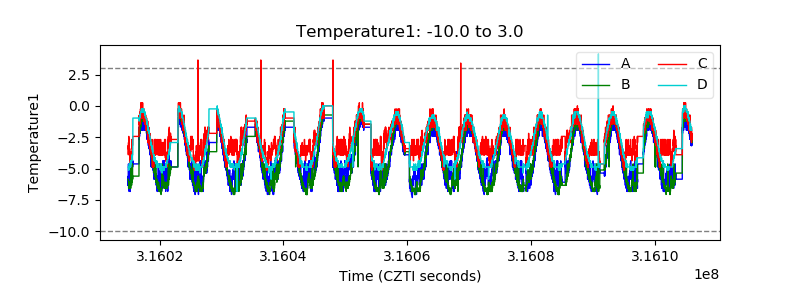 |
| Veto HV Monitor | 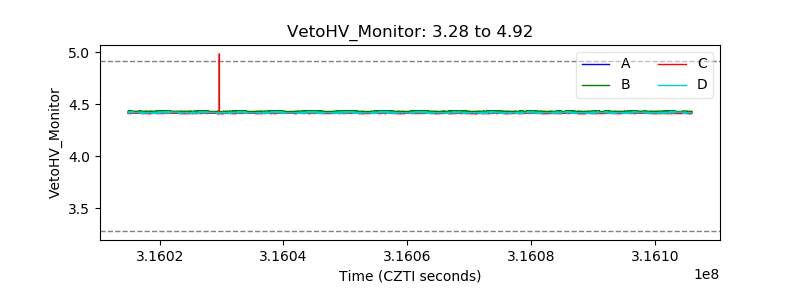 |
| Veto LLD | 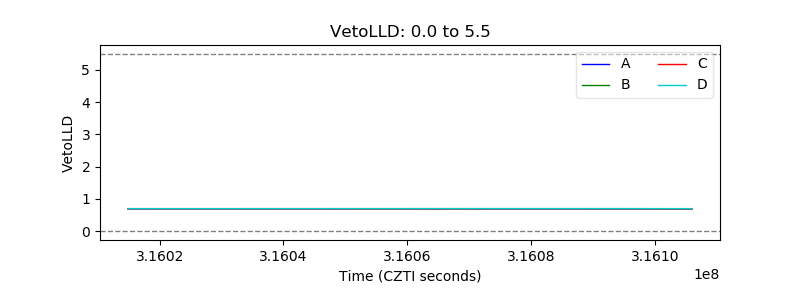 |
| Alpha Counter | 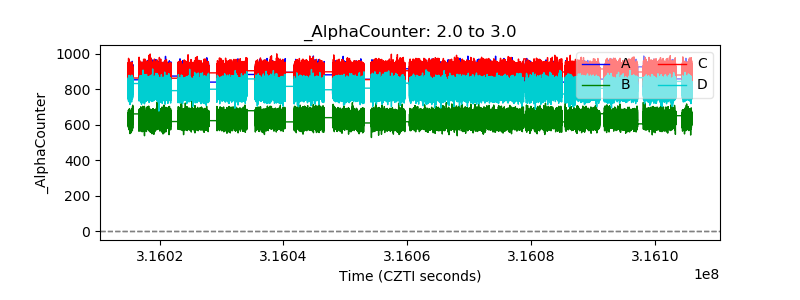 |
| _CPM_Rate | 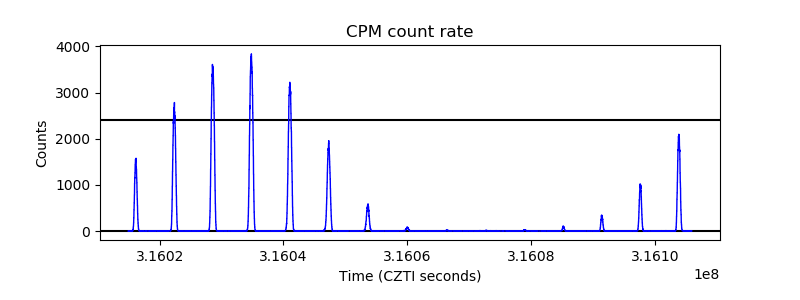 |
| CZT Counter | 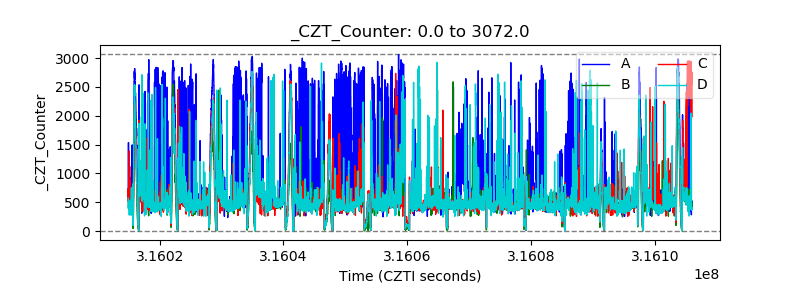 |
| +2.5 Volts monitor | 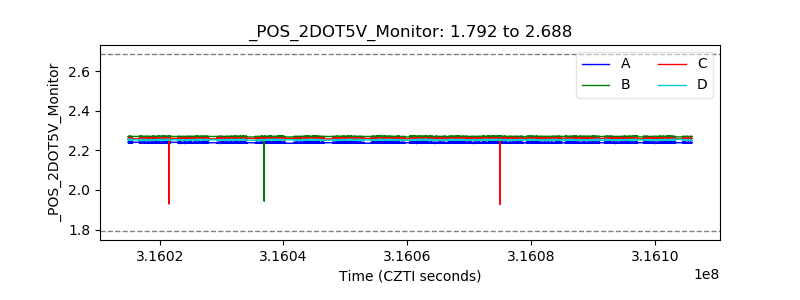 |
| +5 Volts monitor | 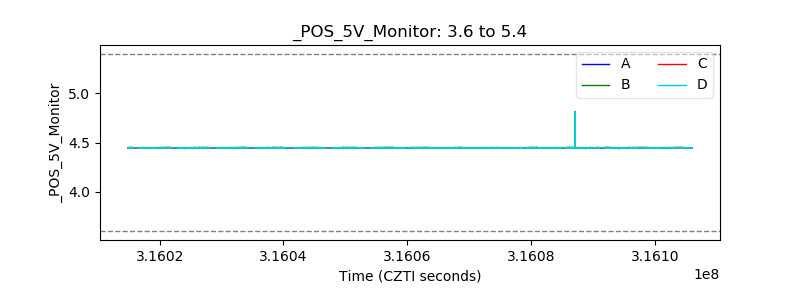 |
| _ROLL_ROT | 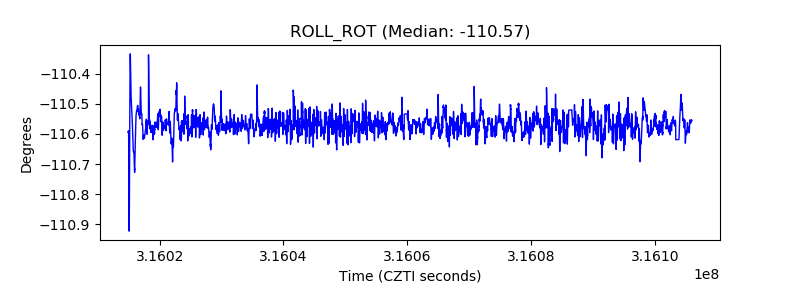 |
| _Roll_DEC | 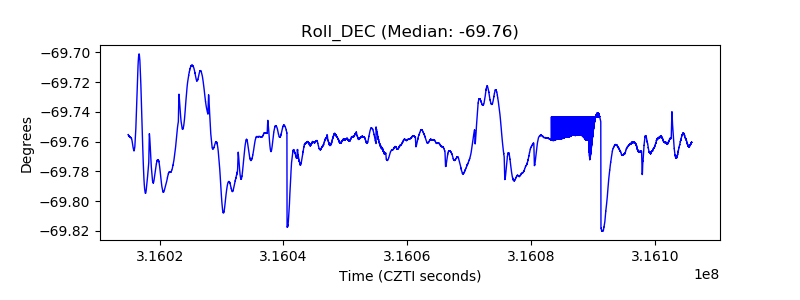 |
| _Roll_RA | 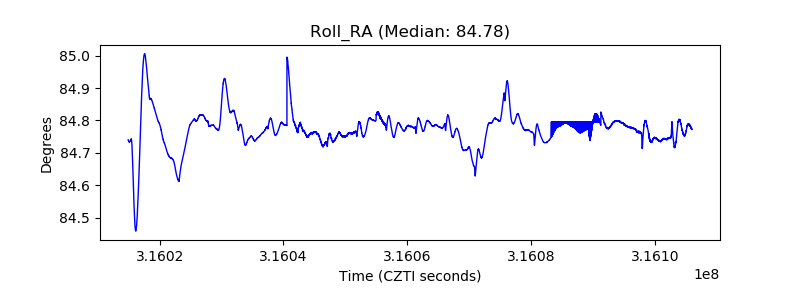 |
| Veto Counter | 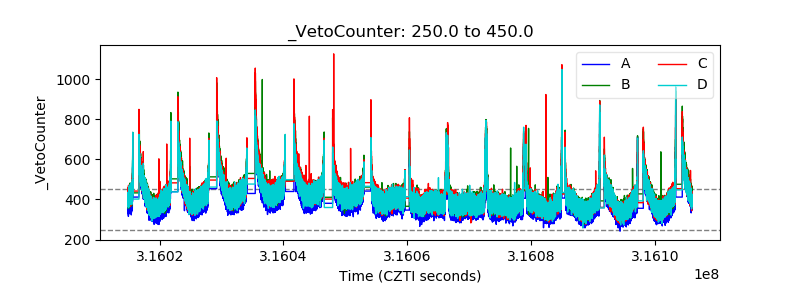 |