| Param | Original file | Final file |
|---|---|---|
| Filename | modeM0/AS1A08_008T02_9000003430cztM0_level2_bc.evt | modeM0/AS1A08_008T02_9000003430cztM0_level2_quad_clean.evt |
| Size (bytes) | 2,772,599,040 | 1,296,077,760 |
| Size | 2.6 GB | 1.2 GB |
| Events in quadrant A | 14,988,290 | 8,901,024 |
| Events in quadrant B | 16,036,644 | 9,002,805 |
| Events in quadrant C | 17,646,450 | 8,452,169 |
| Events in quadrant D | 30,396,984 | 7,973,382 |
| Mode M9 | |||
|---|---|---|---|
| Quadrant | BADHDUFLAG | Total packets | Discarded packets |
| A | 0 | 121 | 0 |
| B | 0 | 122 | 0 |
| C | 0 | 122 | 0 |
| D | 0 | 122 | 0 |
| Mode M0 | |||
|---|---|---|---|
| Quadrant | BADHDUFLAG | Total packets | Discarded packets |
| A | 0 | 148557 | 0 |
| B | 0 | 152348 | 0 |
| C | 0 | 159065 | 0 |
| D | 0 | 203977 | 0 |
| Mode SS | |||
|---|---|---|---|
| Quadrant | BADHDUFLAG | Total packets | Discarded packets |
| A | 0 | 1464 | 0 |
| B | 0 | 1464 | 0 |
| C | 0 | 1464 | 0 |
| D | 0 | 1464 | 0 |
| Quadrant | Total seconds | Saturated seconds | Saturation percentage |
|---|---|---|---|
| A | 71901 | 646 | 0.898458% |
| B | 71901 | 927 | 1.289273% |
| C | 71901 | 1996 | 2.776039% |
| D | 71901 | 6123 | 8.515876% |
Noise dominated data is calculated using 1-second bins in cleaned event files. If a bin has >2000 counts, and if more than 50% of those come from <1% of pixels, then it is considered to be noise-dominated and hence unusable.
| Quadrant | # 1 sec bins | Bins with >0 counts | Bins with >2000 counts | High rate bins dominated by noise | Noise dominated (total time) | Noise dominated (detector-on time) | Marked lightcurve |
|---|---|---|---|---|---|---|---|
| A | 83315 | 71901 | 0 | 0 | 0.00% | 0.00% |  |
| B | 83315 | 71901 | 11 | 11 | 0.01% | 0.02% | 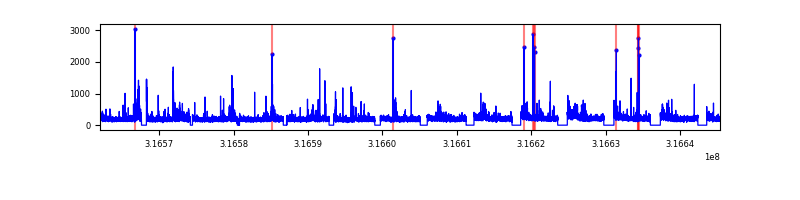 |
| C | 83315 | 71895 | 48 | 48 | 0.06% | 0.07% | 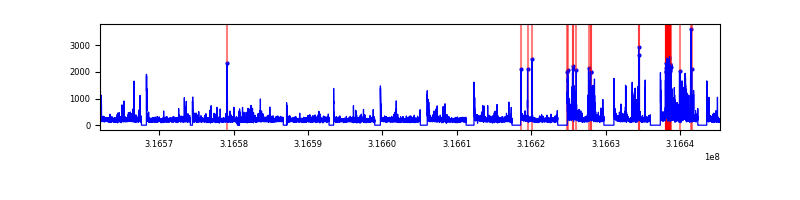 |
| D | 83315 | 71894 | 2404 | 2404 | 2.89% | 3.34% |  |
Top three noisy pixels from each quadrant. If the there are fewer than three noisy pixels in the level2.evt file, extra rows are filled as -1
| Pixel properties | Quadrant properties | ||||||
|---|---|---|---|---|---|---|---|
| Quadrant | DetID | PixID | Counts | Sigma | Mean | Median | Sigma |
| A | 13 | 254 | 103653 | 118.0 | 3872 | 3817 | 846.0 |
| A | 0 | 226 | 25018 | 25.06 | 3872 | 3817 | 846.0 |
| A | 12 | 194 | 24531 | 24.48 | 3872 | 3817 | 846.0 |
| B | 0 | 190 | 454427 | 610.37 | 3905 | 3818 | 738.3 |
| B | 15 | 32 | 142148 | 187.37 | 3905 | 3818 | 738.3 |
| B | 12 | 17 | 122415 | 160.65 | 3905 | 3818 | 738.3 |
| C | 2 | 16 | 1421038 | 1654.05 | 3670 | 3662 | 856.9 |
| C | 0 | 10 | 1247456 | 1451.48 | 3670 | 3662 | 856.9 |
| C | 7 | 247 | 744615 | 864.68 | 3670 | 3662 | 856.9 |
| D | 1 | 52 | 9476234 | 11146.21 | 3630 | 3513 | 849.9 |
| D | 13 | 153 | 2912548 | 3422.96 | 3630 | 3513 | 849.9 |
| D | 7 | 238 | 1178375 | 1382.42 | 3630 | 3513 | 849.9 |
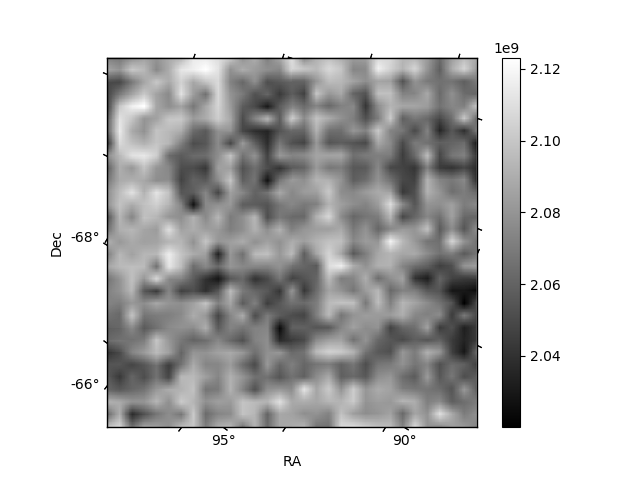
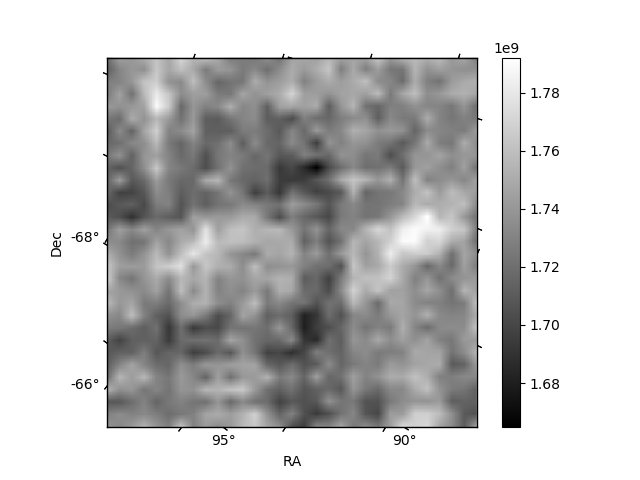
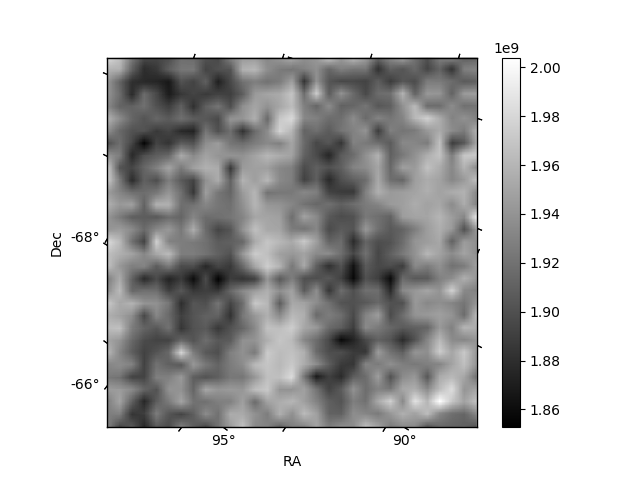
Histogram calculated using DETX and DETY for each event in the final _common_clean file
| Quadrant A |  |
 |
Quadrant B |
|---|---|---|---|
| Quadrant D |  |
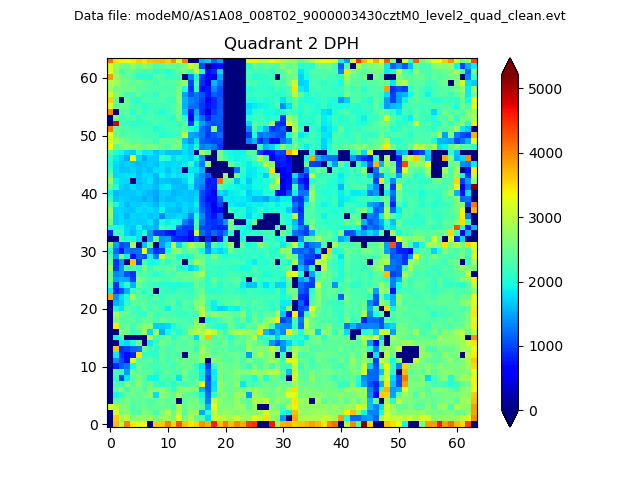 |
Quadrant C |
| Plot type | Count rate plots | Images |
|---|---|---|
| Comparison with Poisson distribution Blue bars denote a histogram of data divided into 1 sec bins. Red curve is a Poisson curve with rate = median count rate of data. |
 |
 |
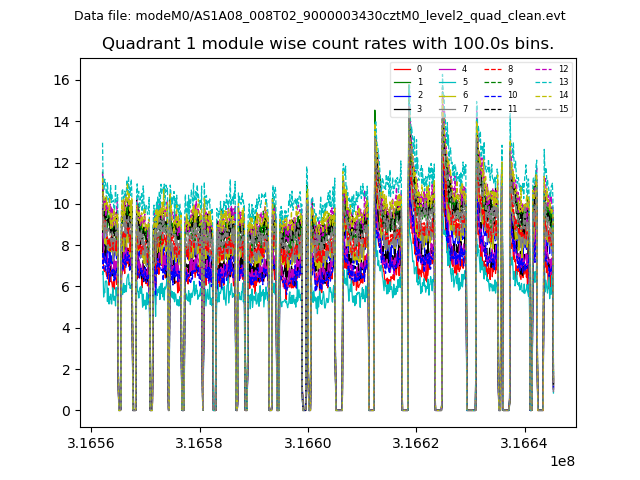
| Quadrant-wise count rates Data is divided into 100 sec bins |
 |
|
| Module-wise count rates for Quadrant A Data is divided into 100 sec bins |
 |
 |
| Module-wise count rates for Quadrant B Data is divided into 100 sec bins |
 |
 |
| Module-wise count rates for Quadrant C Data is divided into 100 sec bins |
 |
 |
| Module-wise count rates for Quadrant D Data is divided into 100 sec bins |
 |
 |
| Parameter | Plot |
|---|---|
| CZT HV Monitor |  |
| D_VDD | 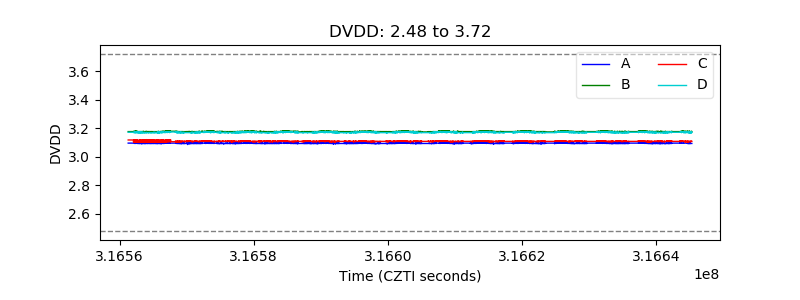 |
| Temperature 1 |  |
| Veto HV Monitor |  |
| Veto LLD |  |
| Alpha Counter | 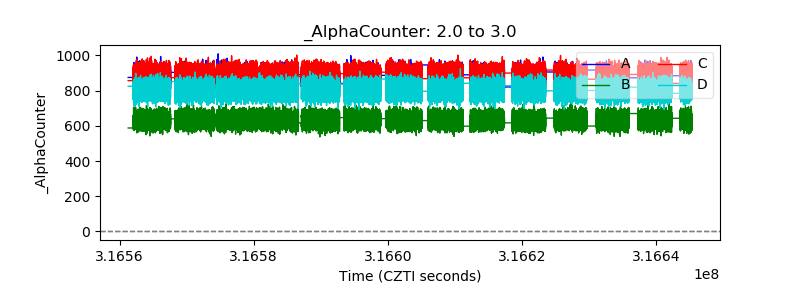 |
| _CPM_Rate |  |
| CZT Counter |  |
| +2.5 Volts monitor |  |
| +5 Volts monitor |  |
| _ROLL_ROT |  |
| _Roll_DEC |  |
| _Roll_RA |  |
| Veto Counter |  |