| Param | Original file | Final file |
|---|---|---|
| Filename | modeM0/AS1A07_027T15_9000003562cztM0_level2_bc.evt | modeM0/AS1A07_027T15_9000003562cztM0_level2_quad_clean.evt |
| Size (bytes) | 835,274,880 | 252,411,840 |
| Size | 796.6 MB | 240.7 MB |
| Events in quadrant A | 4,936,700 | 1,605,594 |
| Events in quadrant B | 4,885,410 | 1,616,821 |
| Events in quadrant C | 4,579,085 | 1,542,503 |
| Events in quadrant D | 9,520,506 | 1,495,012 |
| Mode M0 | |||
|---|---|---|---|
| Quadrant | BADHDUFLAG | Total packets | Discarded packets |
| A | 0 | 43428 | 0 |
| B | 0 | 43290 | 0 |
| C | 0 | 43027 | 0 |
| D | 0 | 60575 | 0 |
| Mode SS | |||
|---|---|---|---|
| Quadrant | BADHDUFLAG | Total packets | Discarded packets |
| A | 0 | 410 | 0 |
| B | 0 | 410 | 0 |
| C | 0 | 410 | 0 |
| D | 0 | 410 | 0 |
| Mode M9 | |||
|---|---|---|---|
| Quadrant | BADHDUFLAG | Total packets | Discarded packets |
| A | 0 | 43 | 0 |
| B | 0 | 43 | 0 |
| C | 0 | 43 | 0 |
| D | 0 | 43 | 0 |
| Quadrant | Total seconds | Saturated seconds | Saturation percentage |
|---|---|---|---|
| A | 20102 | 167 | 0.830763% |
| B | 20102 | 181 | 0.900408% |
| C | 20102 | 231 | 1.149139% |
| D | 20102 | 1096 | 5.452194% |
Noise dominated data is calculated using 1-second bins in cleaned event files. If a bin has >2000 counts, and if more than 50% of those come from <1% of pixels, then it is considered to be noise-dominated and hence unusable.
| Quadrant | # 1 sec bins | Bins with >0 counts | Bins with >2000 counts | High rate bins dominated by noise | Noise dominated (total time) | Noise dominated (detector-on time) | Marked lightcurve |
|---|---|---|---|---|---|---|---|
| A | 33033 | 20100 | 5 | 5 | 0.02% | 0.02% | 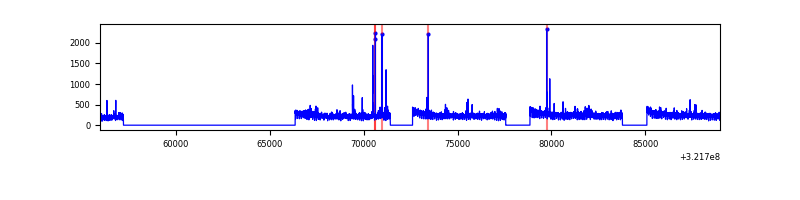 |
| B | 33033 | 20101 | 3 | 3 | 0.01% | 0.01% | 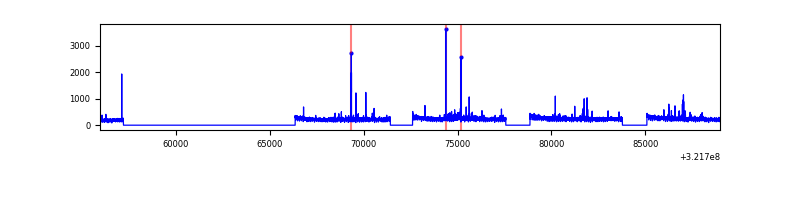 |
| C | 33033 | 20103 | 0 | 0 | 0.00% | 0.00% |  |
| D | 33033 | 20101 | 174 | 174 | 0.53% | 0.87% |  |
Top three noisy pixels from each quadrant. If the there are fewer than three noisy pixels in the level2.evt file, extra rows are filled as -1
| Pixel properties | Quadrant properties | ||||||
|---|---|---|---|---|---|---|---|
| Quadrant | DetID | PixID | Counts | Sigma | Mean | Median | Sigma |
| A | 6 | 16 | 74951 | 282.32 | 1242 | 1226 | 261.1 |
| A | 2 | 250 | 74599 | 280.97 | 1242 | 1226 | 261.1 |
| A | 13 | 254 | 33103 | 122.07 | 1242 | 1226 | 261.1 |
| B | 0 | 190 | 62350 | 268.47 | 1231 | 1208 | 227.7 |
| B | 5 | 172 | 34210 | 144.91 | 1231 | 1208 | 227.7 |
| B | 15 | 33 | 27300 | 114.57 | 1231 | 1208 | 227.7 |
| C | 0 | 239 | 60242 | 218.77 | 1172 | 1172 | 270.0 |
| C | 7 | 247 | 19658 | 68.46 | 1172 | 1172 | 270.0 |
| C | 13 | 61 | 6984 | 21.53 | 1172 | 1172 | 270.0 |
| D | 8 | 195 | 2488468 | 9260.81 | 1190 | 1155 | 268.6 |
| D | 1 | 52 | 901822 | 3353.38 | 1190 | 1155 | 268.6 |
| D | 11 | 176 | 738285 | 2744.5 | 1190 | 1155 | 268.6 |
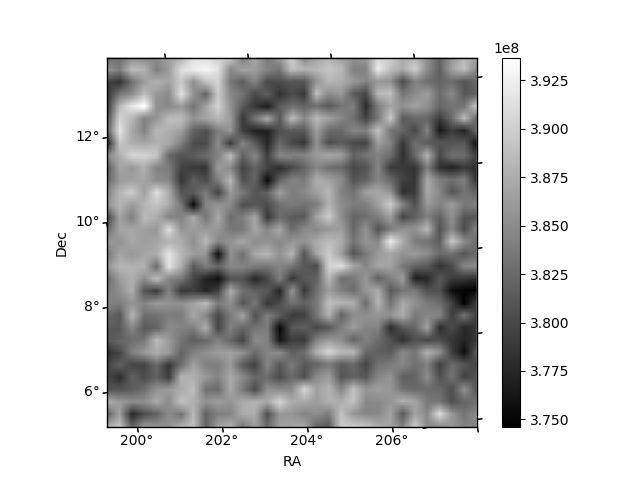
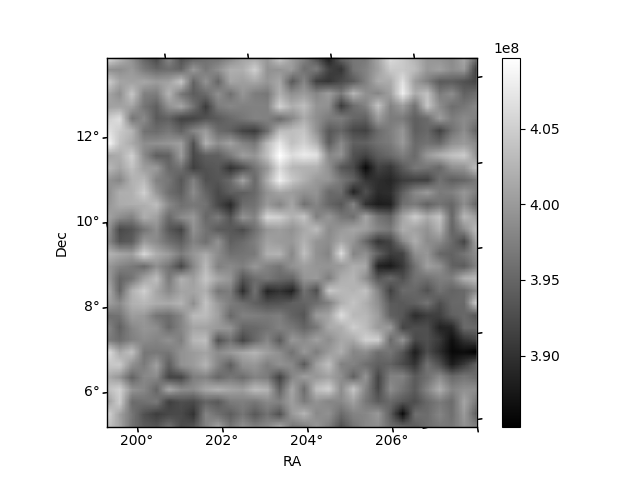
Histogram calculated using DETX and DETY for each event in the final _common_clean file
| Quadrant A |  |
 |
Quadrant B |
|---|---|---|---|
| Quadrant D |  |
 |
Quadrant C |
| Plot type | Count rate plots | Images |
|---|---|---|
| Comparison with Poisson distribution Blue bars denote a histogram of data divided into 1 sec bins. Red curve is a Poisson curve with rate = median count rate of data. |
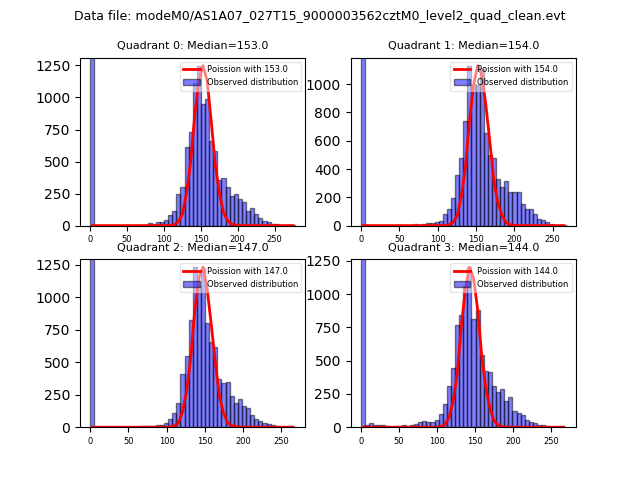 |
 |
| Quadrant-wise count rates Data is divided into 100 sec bins |
 |
|
| Module-wise count rates for Quadrant A Data is divided into 100 sec bins |
 |
 |
| Module-wise count rates for Quadrant B Data is divided into 100 sec bins |
 |
 |
| Module-wise count rates for Quadrant C Data is divided into 100 sec bins |
 |
 |
| Module-wise count rates for Quadrant D Data is divided into 100 sec bins |
 |
 |
| Parameter | Plot |
|---|---|
| CZT HV Monitor | 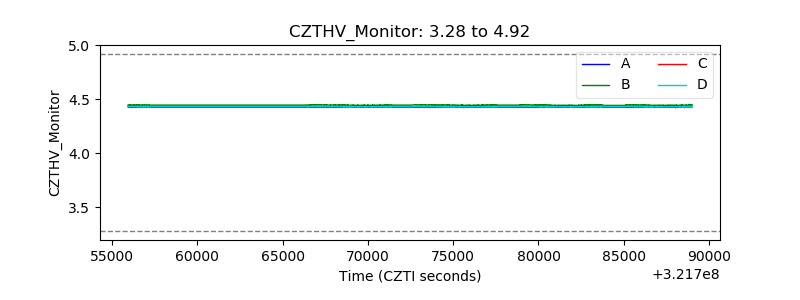 |
| D_VDD | 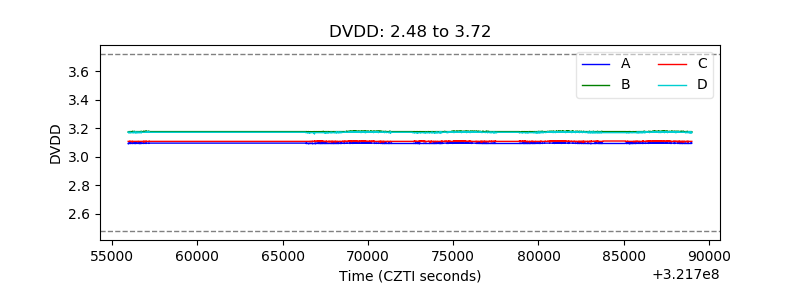 |
| Temperature 1 | 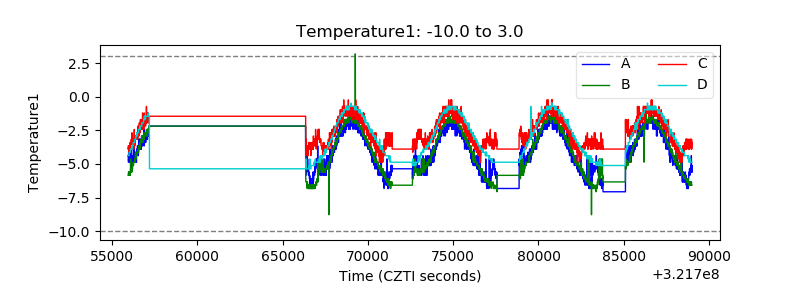 |
| Veto HV Monitor |  |
| Veto LLD |  |
| Alpha Counter |  |
| _CPM_Rate |  |
| CZT Counter |  |
| +2.5 Volts monitor |  |
| +5 Volts monitor | 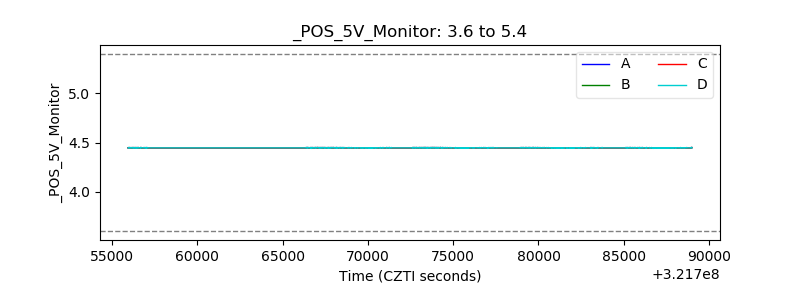 |
| _ROLL_ROT |  |
| _Roll_DEC | 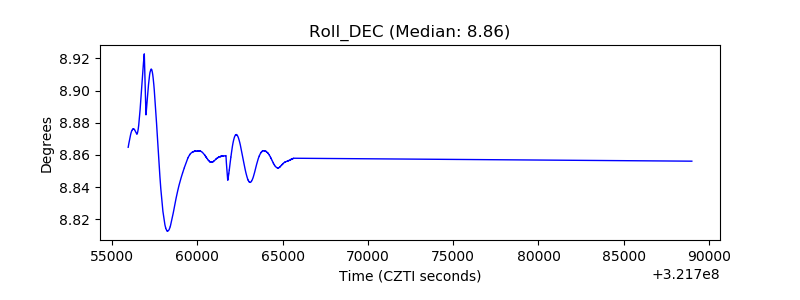 |
| _Roll_RA |  |
| Veto Counter |  |