| Param | Original file | Final file |
|---|---|---|
| Filename | modeM0/AS1A07_027T10_9000003592cztM0_level2_bc.evt | modeM0/AS1A07_027T10_9000003592cztM0_level2_quad_clean.evt |
| Size (bytes) | 747,192,960 | 183,588,480 |
| Size | 712.6 MB | 175.1 MB |
| Events in quadrant A | 3,128,207 | 1,149,623 |
| Events in quadrant B | 3,181,487 | 1,168,737 |
| Events in quadrant C | 5,919,128 | 1,107,270 |
| Events in quadrant D | 9,330,743 | 1,057,223 |
| Mode SS | |||
|---|---|---|---|
| Quadrant | BADHDUFLAG | Total packets | Discarded packets |
| A | 0 | 320 | 0 |
| B | 0 | 320 | 0 |
| C | 0 | 320 | 0 |
| D | 0 | 320 | 0 |
| Mode M9 | |||
|---|---|---|---|
| Quadrant | BADHDUFLAG | Total packets | Discarded packets |
| A | 0 | 9 | 0 |
| B | 0 | 9 | 0 |
| C | 0 | 9 | 0 |
| D | 0 | 9 | 0 |
| Mode M0 | |||
|---|---|---|---|
| Quadrant | BADHDUFLAG | Total packets | Discarded packets |
| A | 0 | 32453 | 0 |
| B | 0 | 32570 | 0 |
| C | 0 | 41806 | 0 |
| D | 0 | 57252 | 0 |
| Quadrant | Total seconds | Saturated seconds | Saturation percentage |
|---|---|---|---|
| A | 15622 | 573 | 3.667904% |
| B | 15622 | 625 | 4.000768% |
| C | 15622 | 799 | 5.114582% |
| D | 15622 | 1756 | 11.240558% |
Noise dominated data is calculated using 1-second bins in cleaned event files. If a bin has >2000 counts, and if more than 50% of those come from <1% of pixels, then it is considered to be noise-dominated and hence unusable.
| Quadrant | # 1 sec bins | Bins with >0 counts | Bins with >2000 counts | High rate bins dominated by noise | Noise dominated (total time) | Noise dominated (detector-on time) | Marked lightcurve |
|---|---|---|---|---|---|---|---|
| A | 16362 | 15621 | 0 | 0 | 0.00% | 0.00% | 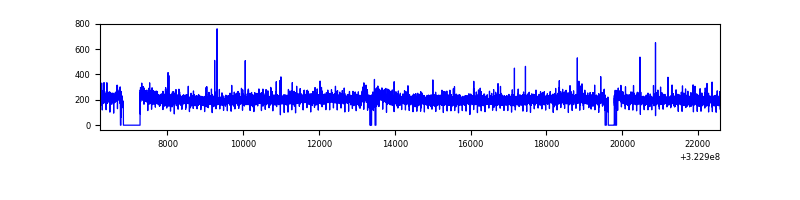 |
| B | 16362 | 15618 | 0 | 0 | 0.00% | 0.00% | 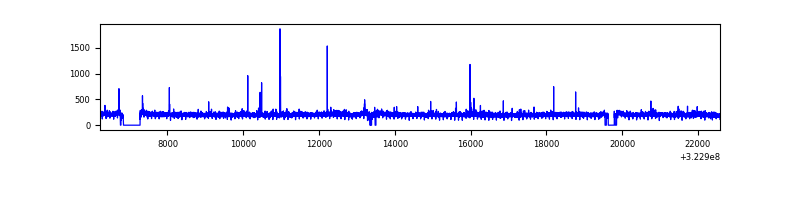 |
| C | 16362 | 15620 | 2 | 2 | 0.01% | 0.01% | 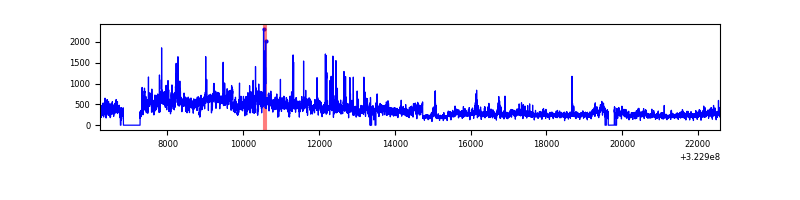 |
| D | 16362 | 15617 | 149 | 149 | 0.91% | 0.95% | 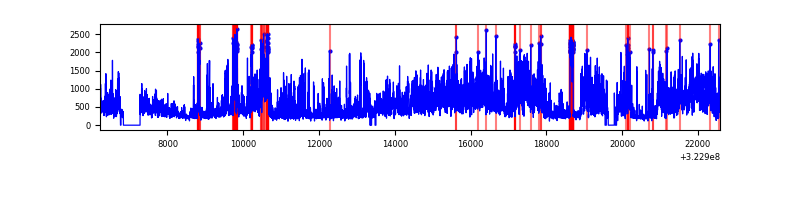 |
Top three noisy pixels from each quadrant. If the there are fewer than three noisy pixels in the level2.evt file, extra rows are filled as -1
| Pixel properties | Quadrant properties | ||||||
|---|---|---|---|---|---|---|---|
| Quadrant | DetID | PixID | Counts | Sigma | Mean | Median | Sigma |
| A | 13 | 254 | 22167 | 120.43 | 806 | 789 | 177.5 |
| A | 0 | 226 | 5347 | 25.68 | 806 | 789 | 177.5 |
| A | 12 | 194 | 4858 | 22.92 | 806 | 789 | 177.5 |
| B | 0 | 230 | 19760 | 119.68 | 815 | 794 | 158.5 |
| B | 0 | 190 | 16394 | 98.44 | 815 | 794 | 158.5 |
| B | 4 | 52 | 13941 | 82.96 | 815 | 794 | 158.5 |
| C | 7 | 247 | 2632118 | 14174.37 | 779 | 773 | 185.6 |
| C | 2 | 16 | 265945 | 1428.41 | 779 | 773 | 185.6 |
| C | 8 | 128 | 11414 | 57.32 | 779 | 773 | 185.6 |
| D | 1 | 52 | 4953474 | 26777.54 | 777 | 746 | 185.0 |
| D | 8 | 195 | 853383 | 4609.89 | 777 | 746 | 185.0 |
| D | 12 | 233 | 321635 | 1734.93 | 777 | 746 | 185.0 |
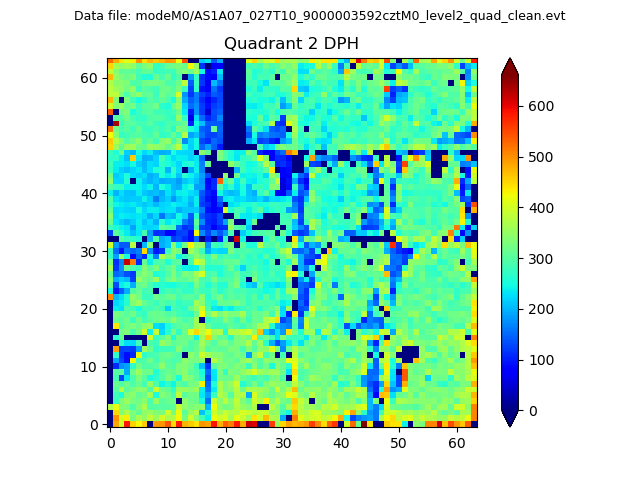
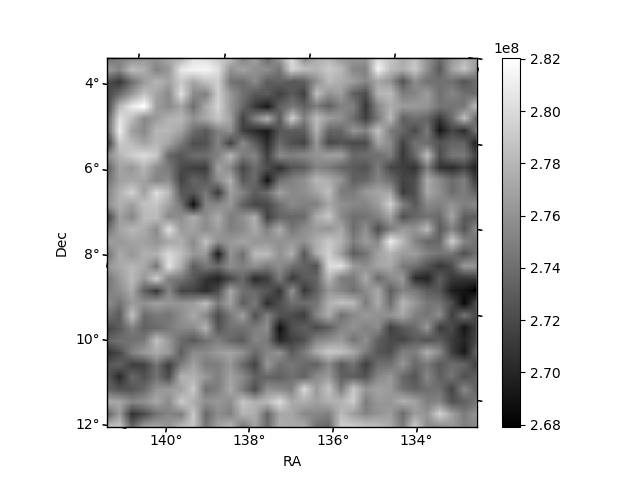
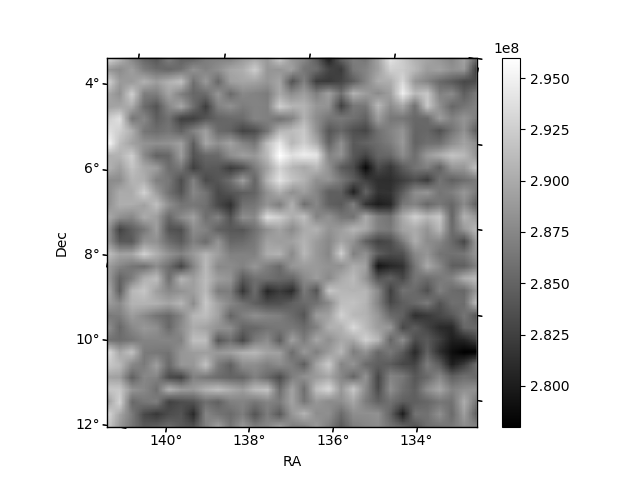
Histogram calculated using DETX and DETY for each event in the final _common_clean file
| Quadrant A | 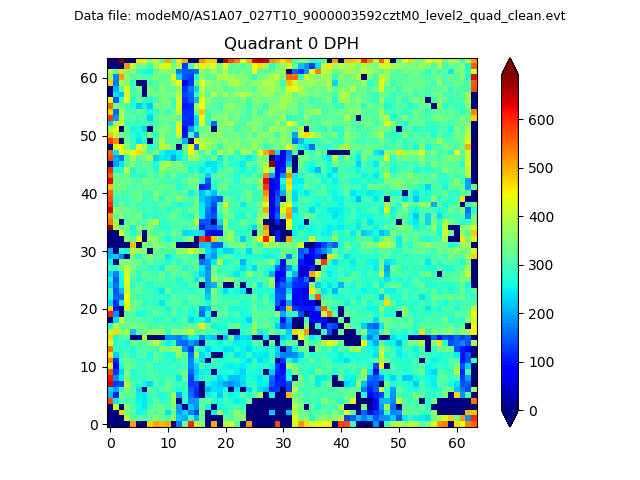 |
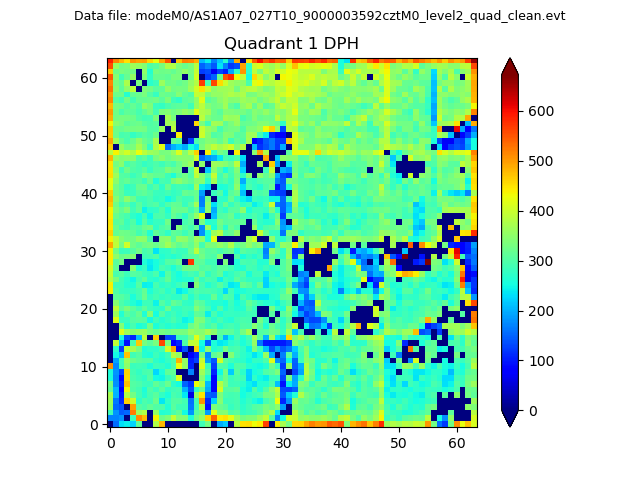 |
Quadrant B |
|---|---|---|---|
| Quadrant D | 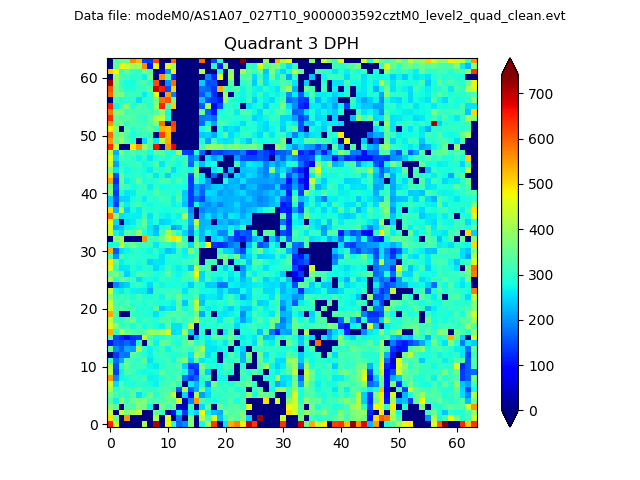 |
 |
Quadrant C |
| Plot type | Count rate plots | Images |
|---|---|---|
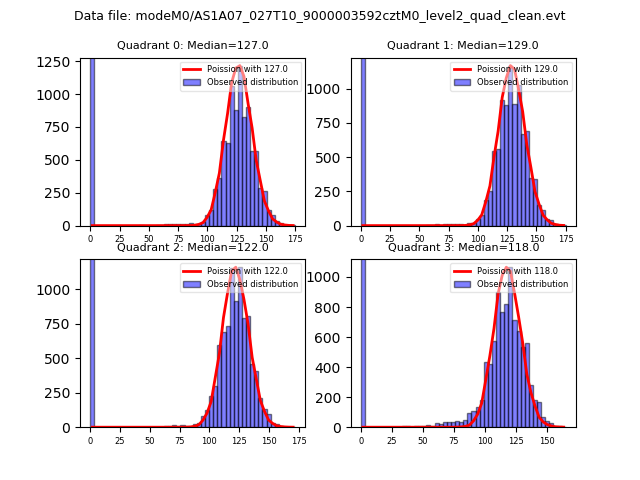
| Comparison with Poisson distribution Blue bars denote a histogram of data divided into 1 sec bins. Red curve is a Poisson curve with rate = median count rate of data. |
 |
 |
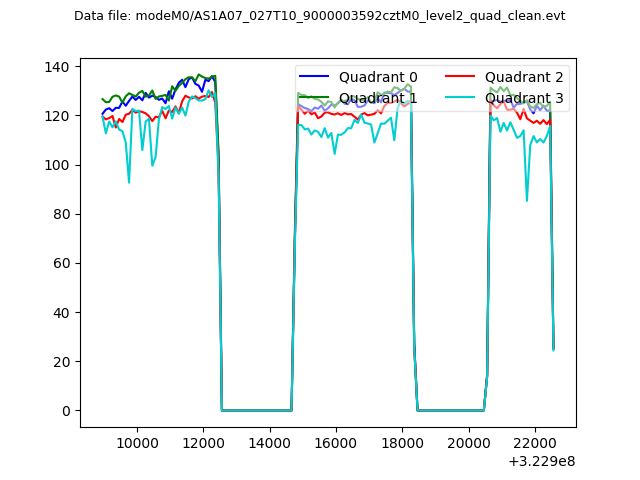
| Quadrant-wise count rates Data is divided into 100 sec bins |
 |
|
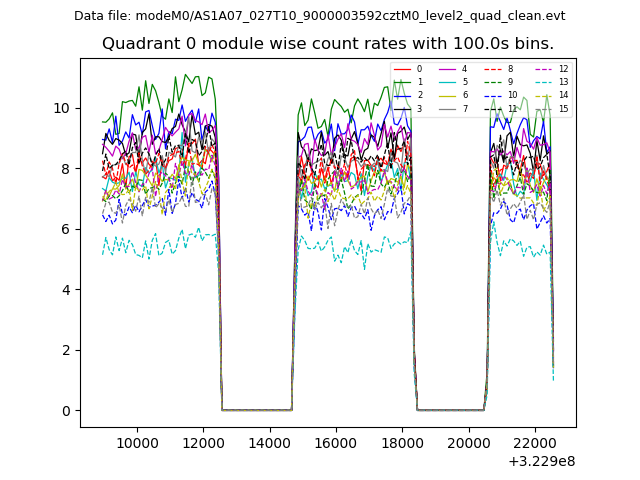
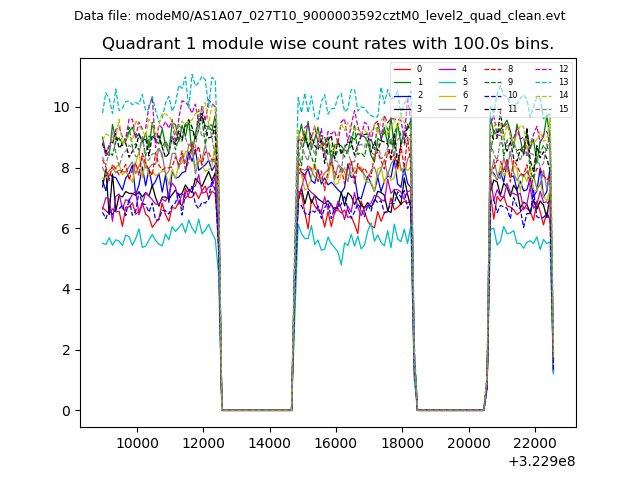
| Module-wise count rates for Quadrant A Data is divided into 100 sec bins |
 |
 |
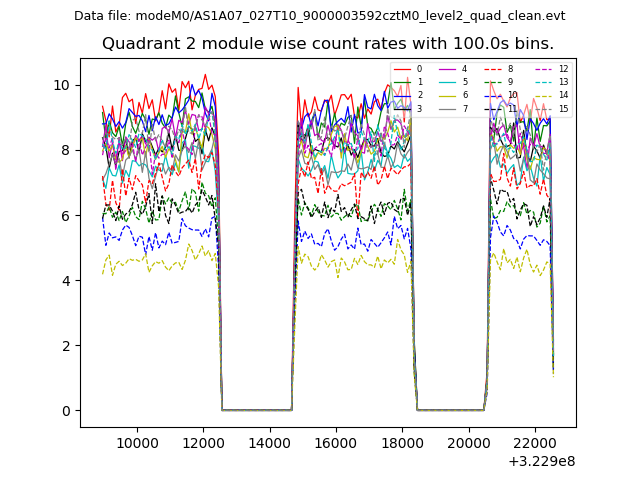
| Module-wise count rates for Quadrant B Data is divided into 100 sec bins |
 |
 |
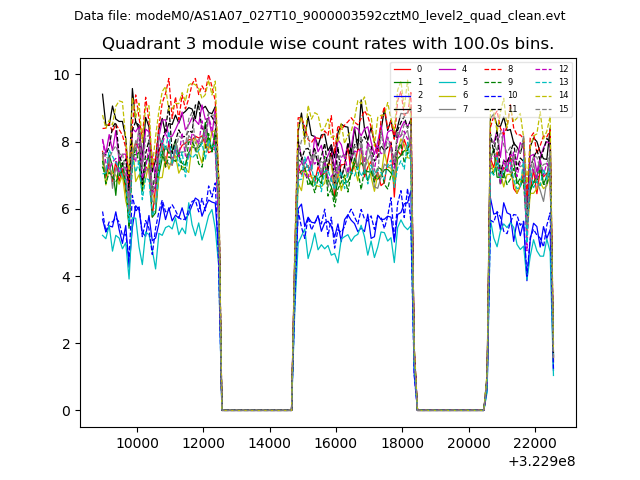
| Module-wise count rates for Quadrant C Data is divided into 100 sec bins |
 |
 |
| Module-wise count rates for Quadrant D Data is divided into 100 sec bins |
 |
 |
| Parameter | Plot |
|---|---|
| CZT HV Monitor | 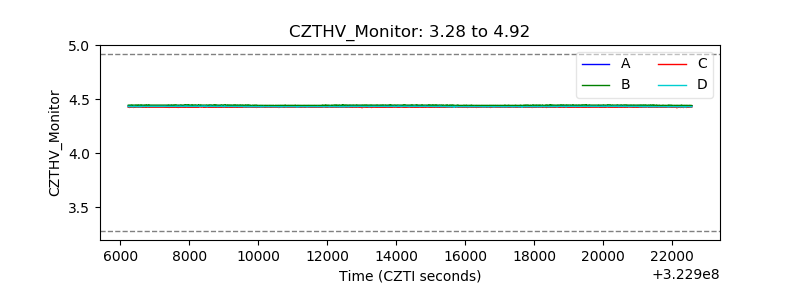 |
| D_VDD | 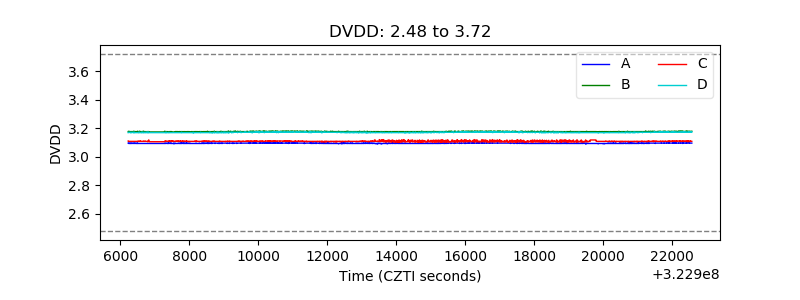 |
| Temperature 1 | 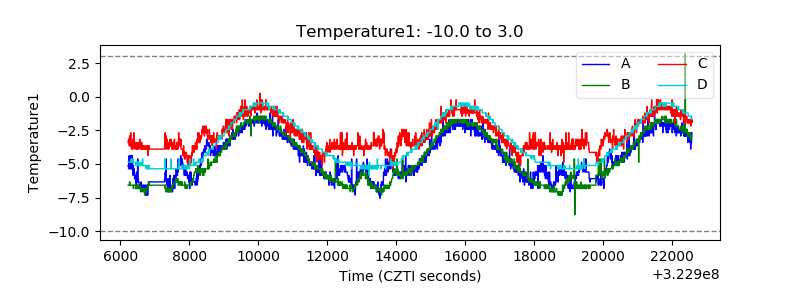 |
| Veto HV Monitor |  |
| Veto LLD | 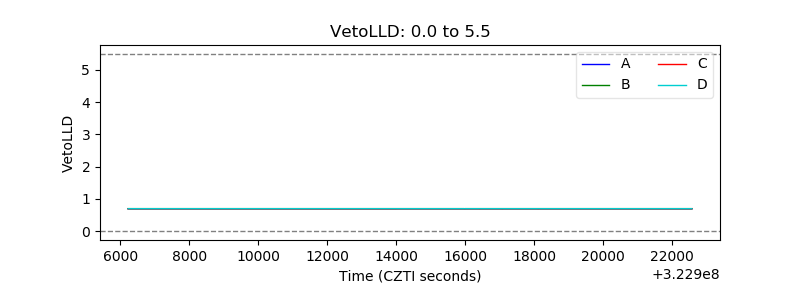 |
| Alpha Counter | 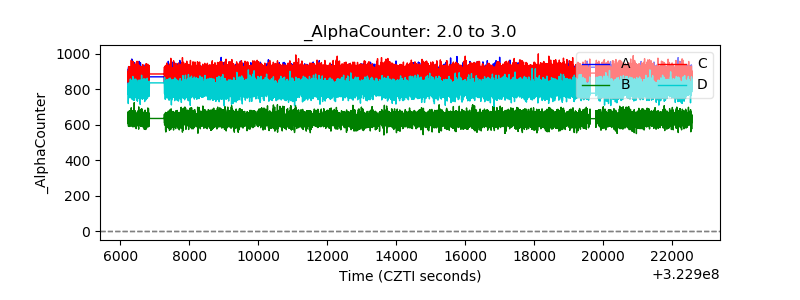 |
| _CPM_Rate | 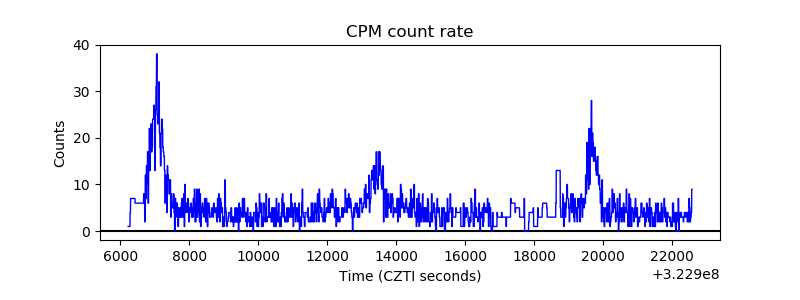 |
| CZT Counter | 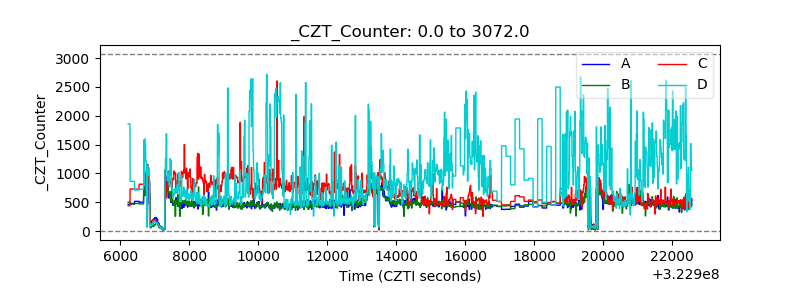 |
| +2.5 Volts monitor | 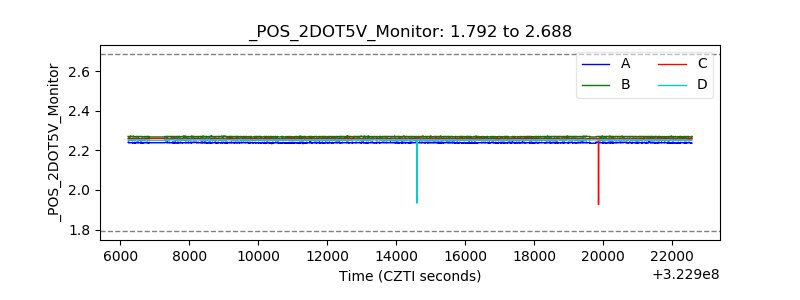 |
| +5 Volts monitor | 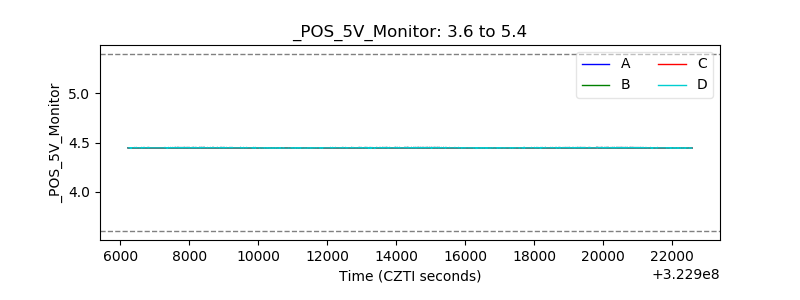 |
| _ROLL_ROT | 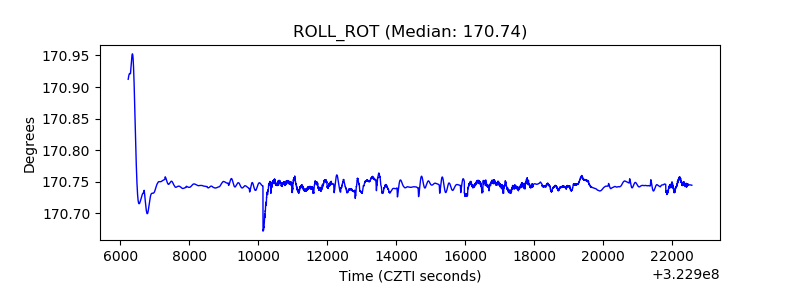 |
| _Roll_DEC | 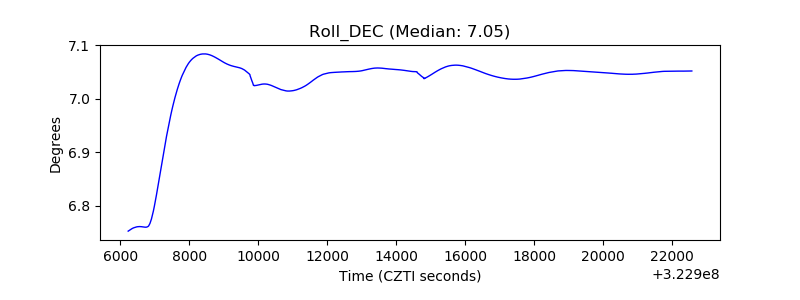 |
| _Roll_RA | 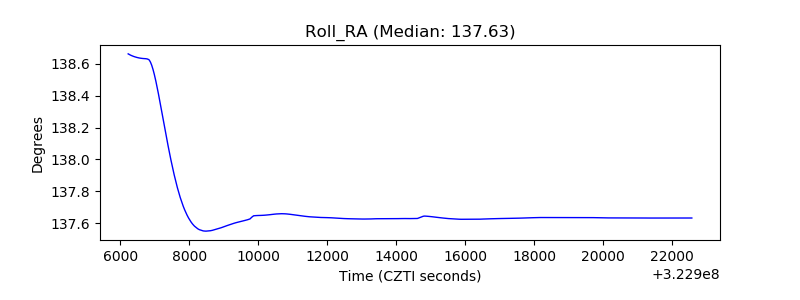 |
| Veto Counter | 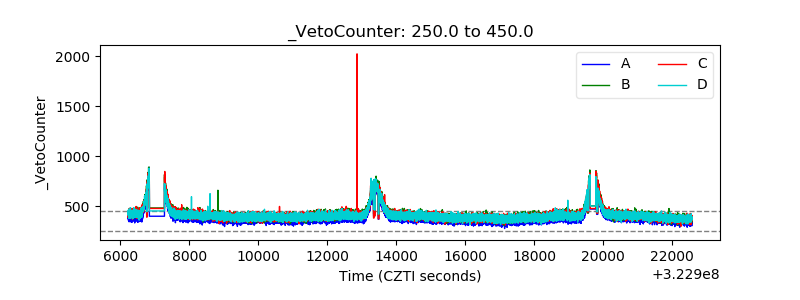 |