| Param | Original file | Final file |
|---|---|---|
| Filename | modeM0/AS1A08_008T01_9000003596cztM0_level2_bc.evt | modeM0/AS1A08_008T01_9000003596cztM0_level2_quad_clean.evt |
| Size (bytes) | 6,497,648,640 | 1,937,534,400 |
| Size | 6.1 GB | 1.8 GB |
| Events in quadrant A | 27,885,168 | 13,097,341 |
| Events in quadrant B | 27,757,344 | 13,354,575 |
| Events in quadrant C | 89,672,217 | 11,690,554 |
| Events in quadrant D | 43,237,308 | 12,241,849 |
| Mode SS | |||
|---|---|---|---|
| Quadrant | BADHDUFLAG | Total packets | Discarded packets |
| A | 0 | 1316 | 0 |
| B | 0 | 1316 | 0 |
| C | 0 | 1316 | 0 |
| D | 0 | 1316 | 0 |
| Mode M0 | |||
|---|---|---|---|
| Quadrant | BADHDUFLAG | Total packets | Discarded packets |
| A | 0 | 269281 | 0 |
| B | 0 | 268817 | 0 |
| C | 0 | 462023 | 0 |
| D | 0 | 320270 | 0 |
| Mode M9 | |||
|---|---|---|---|
| Quadrant | BADHDUFLAG | Total packets | Discarded packets |
| A | 0 | 205 | 0 |
| B | 0 | 208 | 0 |
| C | 0 | 208 | 0 |
| D | 0 | 208 | 0 |
| Quadrant | Total seconds | Saturated seconds | Saturation percentage |
|---|---|---|---|
| A | 129557 | 1547 | 1.194069% |
| B | 129557 | 1687 | 1.302130% |
| C | 129557 | 22876 | 17.657093% |
| D | 129556 | 4591 | 3.543641% |
Noise dominated data is calculated using 1-second bins in cleaned event files. If a bin has >2000 counts, and if more than 50% of those come from <1% of pixels, then it is considered to be noise-dominated and hence unusable.
| Quadrant | # 1 sec bins | Bins with >0 counts | Bins with >2000 counts | High rate bins dominated by noise | Noise dominated (total time) | Noise dominated (detector-on time) | Marked lightcurve |
|---|---|---|---|---|---|---|---|
| A | 158298 | 129560 | 89 | 89 | 0.06% | 0.07% |  |
| B | 158298 | 129560 | 4 | 4 | 0.00% | 0.00% |  |
| C | 158298 | 129562 | 11350 | 11350 | 7.17% | 8.76% |  |
| D | 158298 | 129559 | 933 | 933 | 0.59% | 0.72% | 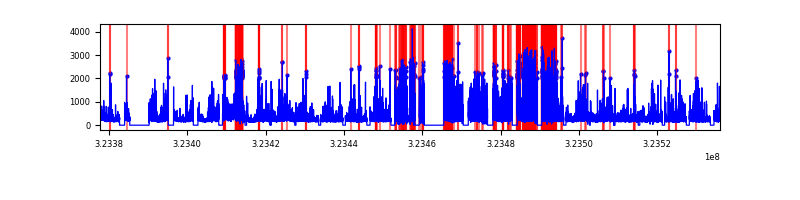 |
Top three noisy pixels from each quadrant. If the there are fewer than three noisy pixels in the level2.evt file, extra rows are filled as -1
| Pixel properties | Quadrant properties | ||||||
|---|---|---|---|---|---|---|---|
| Quadrant | DetID | PixID | Counts | Sigma | Mean | Median | Sigma |
| A | 6 | 10 | 1245056 | 825.56 | 6899 | 6782 | 1499.9 |
| A | 13 | 254 | 198355 | 127.72 | 6899 | 6782 | 1499.9 |
| A | 0 | 226 | 43940 | 24.77 | 6899 | 6782 | 1499.9 |
| B | 4 | 200 | 266112 | 197.2 | 6984 | 6823 | 1314.8 |
| B | 15 | 33 | 225908 | 166.63 | 6984 | 6823 | 1314.8 |
| B | 0 | 190 | 188220 | 137.96 | 6984 | 6823 | 1314.8 |
| C | 7 | 247 | 63850178 | 43369.89 | 6220 | 6190 | 1472.1 |
| C | 2 | 16 | 1683522 | 1139.43 | 6220 | 6190 | 1472.1 |
| C | 7 | 226 | 147523 | 96.01 | 6220 | 6190 | 1472.1 |
| D | 1 | 52 | 9821057 | 6326.33 | 6680 | 6452 | 1551.4 |
| D | 9 | 35 | 2266879 | 1457.03 | 6680 | 6452 | 1551.4 |
| D | 12 | 233 | 2217935 | 1425.49 | 6680 | 6452 | 1551.4 |
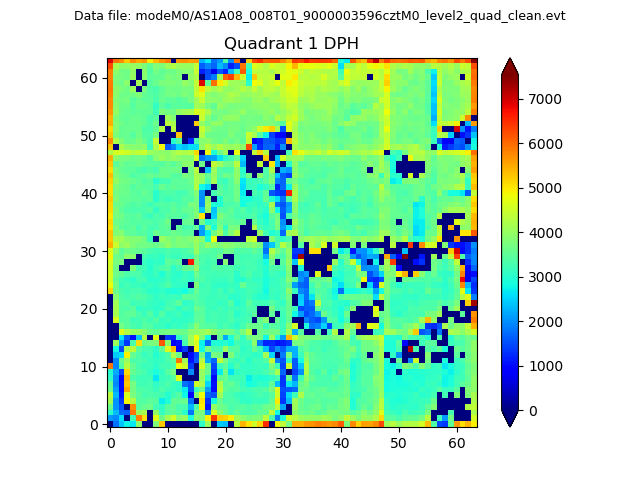
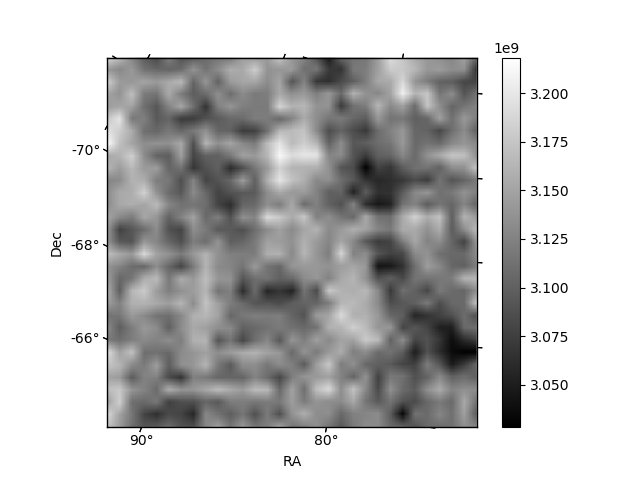
Histogram calculated using DETX and DETY for each event in the final _common_clean file
| Quadrant A |  |
 |
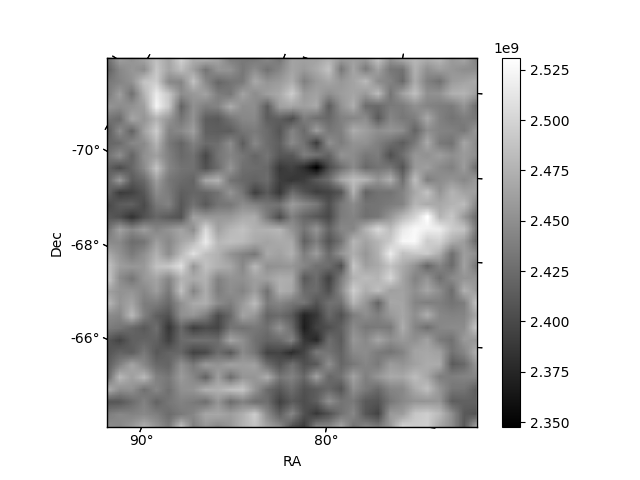
Quadrant B |
|---|---|---|---|
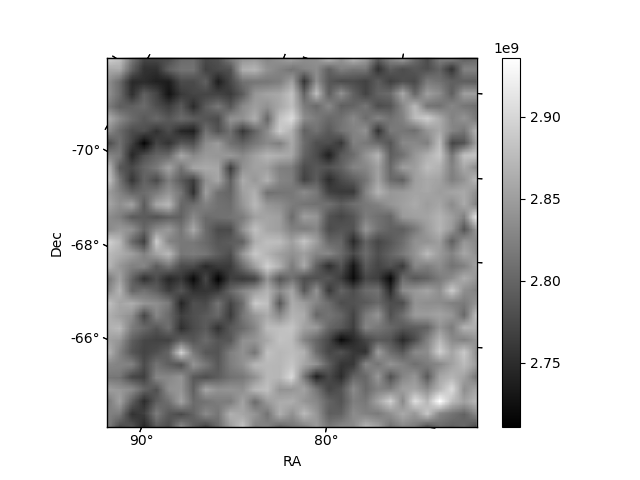
| Quadrant D | 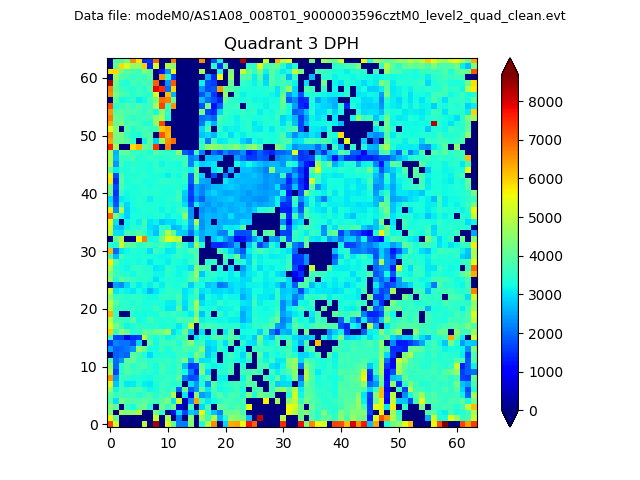 |
 |
Quadrant C |
| Plot type | Count rate plots | Images |
|---|---|---|
| Comparison with Poisson distribution Blue bars denote a histogram of data divided into 1 sec bins. Red curve is a Poisson curve with rate = median count rate of data. |
 |
 |
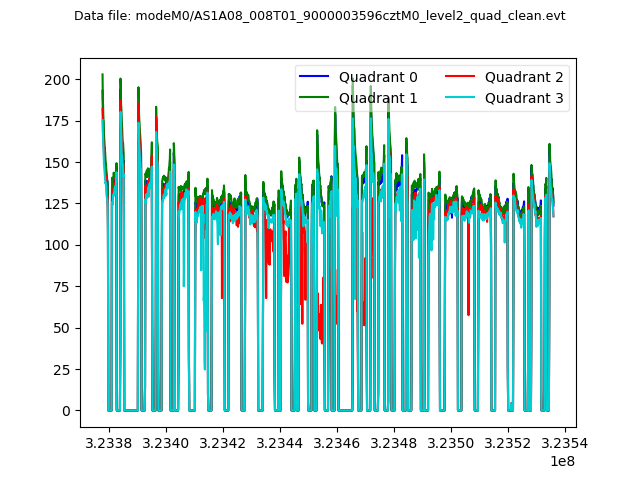
| Quadrant-wise count rates Data is divided into 100 sec bins |
 |
|
| Module-wise count rates for Quadrant A Data is divided into 100 sec bins |
 |
 |
| Module-wise count rates for Quadrant B Data is divided into 100 sec bins |
 |
 |
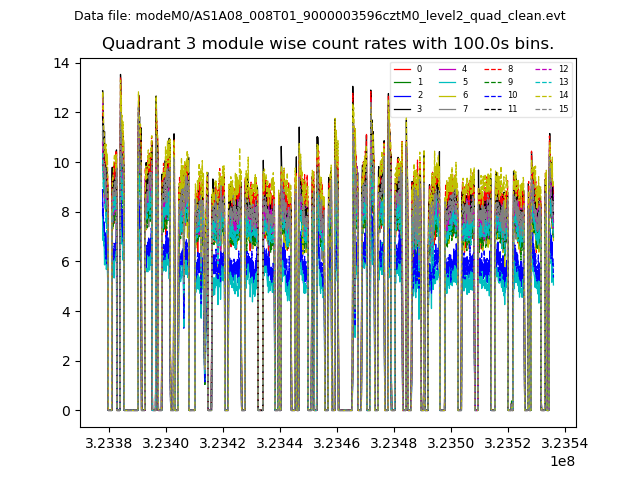
| Module-wise count rates for Quadrant C Data is divided into 100 sec bins |
 |
 |
| Module-wise count rates for Quadrant D Data is divided into 100 sec bins |
 |
 |
| Parameter | Plot |
|---|---|
| CZT HV Monitor | 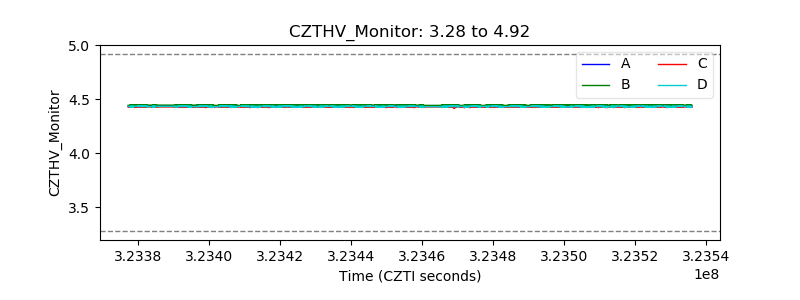 |
| D_VDD | 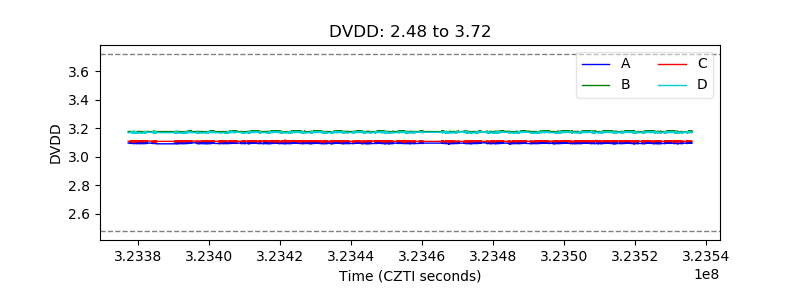 |
| Temperature 1 |  |
| Veto HV Monitor |  |
| Veto LLD |  |
| Alpha Counter |  |
| _CPM_Rate |  |
| CZT Counter |  |
| +2.5 Volts monitor |  |
| +5 Volts monitor |  |
| _ROLL_ROT |  |
| _Roll_DEC | 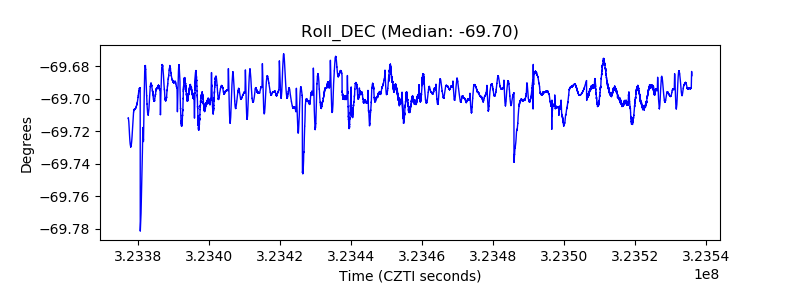 |
| _Roll_RA |  |
| Veto Counter | 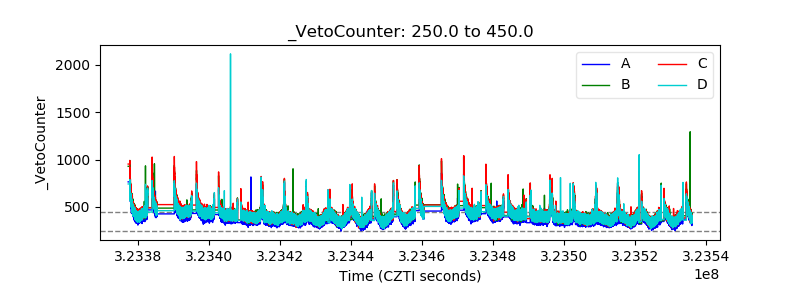 |