| Param | Original file | Final file |
|---|---|---|
| Filename | modeM0/AS1T03_214T01_9000003758cztM0_level2_bc.evt | modeM0/AS1T03_214T01_9000003758cztM0_level2_quad_clean.evt |
| Size (bytes) | 5,134,766,400 | 922,858,560 |
| Size | 4.8 GB | 880.1 MB |
| Events in quadrant A | 96,778,236 | 2,765,216 |
| Events in quadrant B | 15,709,234 | 7,065,546 |
| Events in quadrant C | 15,054,332 | 6,769,385 |
| Events in quadrant D | 23,328,219 | 6,671,521 |
| Mode SS | |||
|---|---|---|---|
| Quadrant | BADHDUFLAG | Total packets | Discarded packets |
| A | 0 | 1384 | 0 |
| B | 0 | 1384 | 0 |
| C | 0 | 1384 | 0 |
| D | 0 | 1384 | 0 |
| Mode M0 | |||
|---|---|---|---|
| Quadrant | BADHDUFLAG | Total packets | Discarded packets |
| A | 0 | 513804 | 0 |
| B | 0 | 144960 | 0 |
| C | 0 | 145343 | 0 |
| D | 0 | 170195 | 0 |
| Mode M9 | |||
|---|---|---|---|
| Quadrant | BADHDUFLAG | Total packets | Discarded packets |
| A | 0 | 133 | 0 |
| B | 0 | 133 | 0 |
| C | 0 | 133 | 0 |
| D | 0 | 133 | 0 |
| Quadrant | Total seconds | Saturated seconds | Saturation percentage |
|---|---|---|---|
| A | 67975 | 57670 | 84.840015% |
| B | 67976 | 799 | 1.175415% |
| C | 67975 | 1109 | 1.631482% |
| D | 67975 | 1800 | 2.648032% |
Noise dominated data is calculated using 1-second bins in cleaned event files. If a bin has >2000 counts, and if more than 50% of those come from <1% of pixels, then it is considered to be noise-dominated and hence unusable.
| Quadrant | # 1 sec bins | Bins with >0 counts | Bins with >2000 counts | High rate bins dominated by noise | Noise dominated (total time) | Noise dominated (detector-on time) | Marked lightcurve |
|---|---|---|---|---|---|---|---|
| A | 117468 | 67725 | 11517 | 11517 | 9.80% | 17.01% |  |
| B | 117468 | 67975 | 3 | 3 | 0.00% | 0.00% | 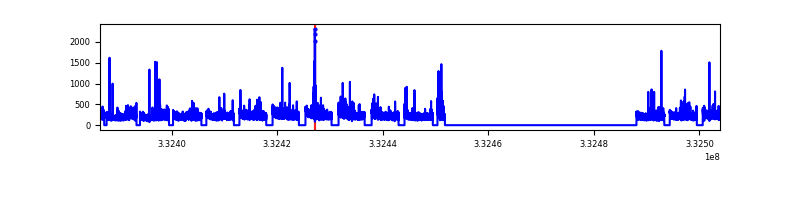 |
| C | 117468 | 67976 | 19 | 19 | 0.02% | 0.03% |  |
| D | 117468 | 67973 | 326 | 326 | 0.28% | 0.48% |  |
Top three noisy pixels from each quadrant. If the there are fewer than three noisy pixels in the level2.evt file, extra rows are filled as -1
| Pixel properties | Quadrant properties | ||||||
|---|---|---|---|---|---|---|---|
| Quadrant | DetID | PixID | Counts | Sigma | Mean | Median | Sigma |
| A | 0 | 13 | 89832054 | 235232.03 | 1784 | 1763 | 381.9 |
| A | 13 | 254 | 45623 | 114.85 | 1784 | 1763 | 381.9 |
| A | 12 | 16 | 45483 | 114.49 | 1784 | 1763 | 381.9 |
| B | 0 | 219 | 338878 | 461.25 | 3858 | 3781 | 726.5 |
| B | 0 | 190 | 291821 | 396.48 | 3858 | 3781 | 726.5 |
| B | 15 | 33 | 114506 | 152.41 | 3858 | 3781 | 726.5 |
| C | 3 | 233 | 623462 | 724.72 | 3659 | 3652 | 855.2 |
| C | 2 | 16 | 378277 | 438.03 | 3659 | 3652 | 855.2 |
| C | 13 | 61 | 20896 | 20.16 | 3659 | 3652 | 855.2 |
| D | 1 | 52 | 7134525 | 8376.72 | 3723 | 3634 | 851.3 |
| D | 7 | 80 | 1244519 | 1457.68 | 3723 | 3634 | 851.3 |
| D | 2 | 234 | 281969 | 326.96 | 3723 | 3634 | 851.3 |
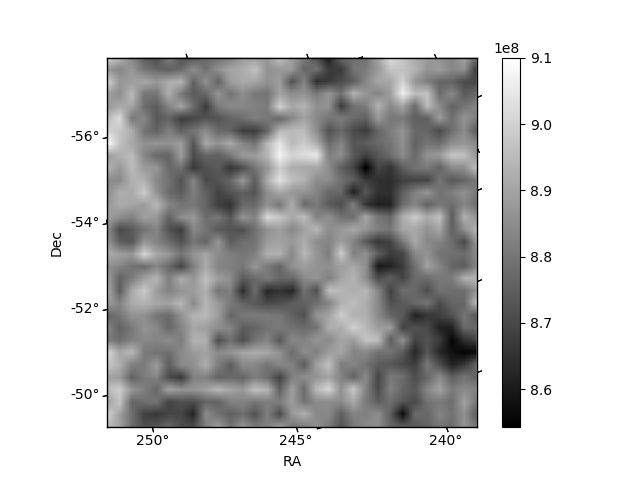
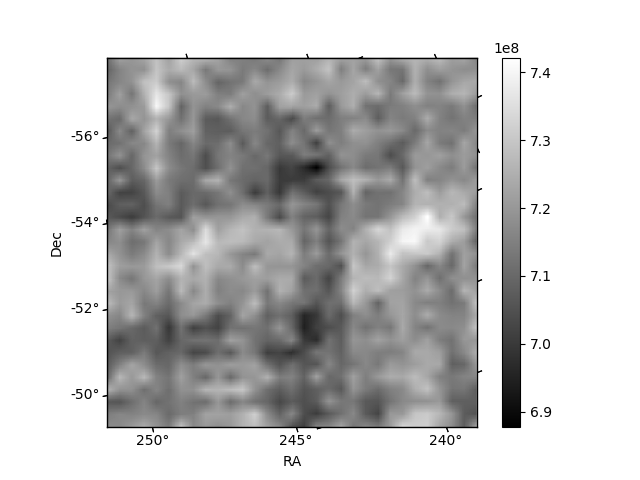
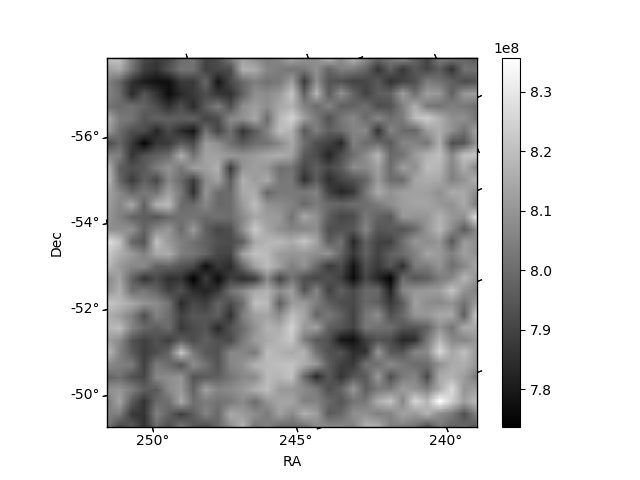
Histogram calculated using DETX and DETY for each event in the final _common_clean file
| Quadrant A | 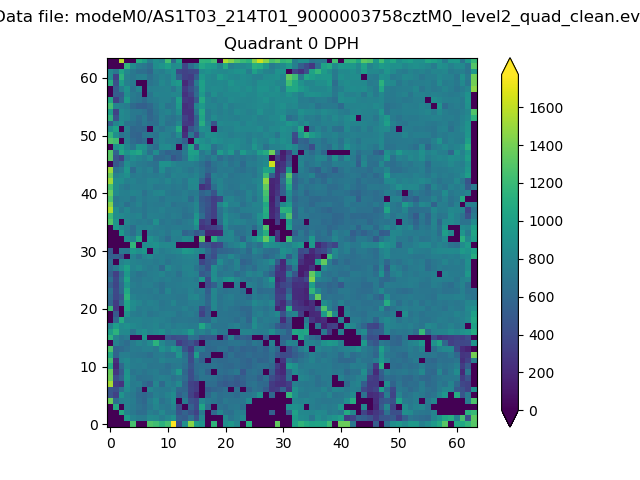 |
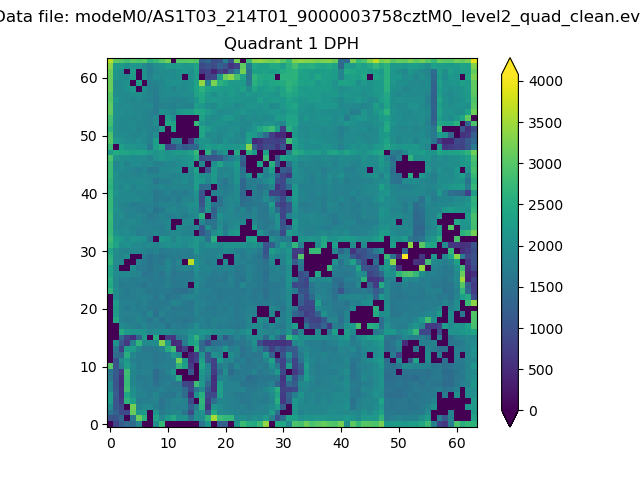 |
Quadrant B |
|---|---|---|---|
| Quadrant D | 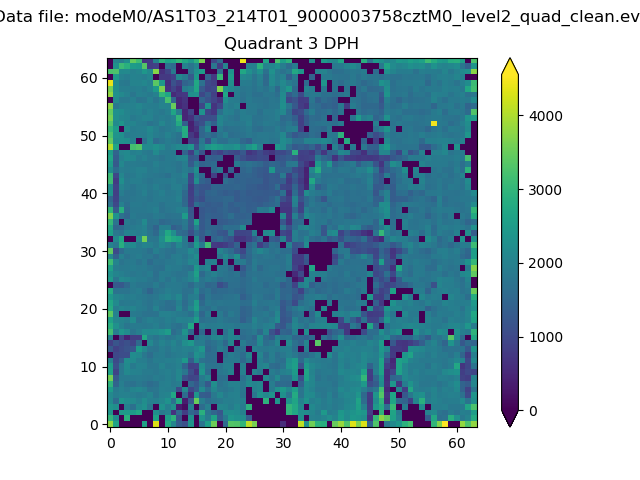 |
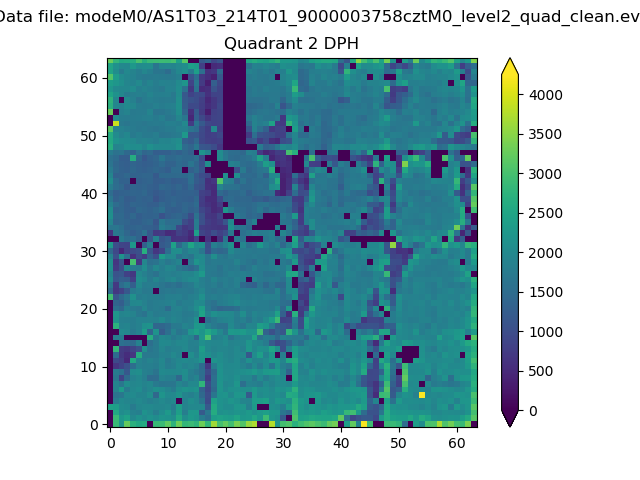 |
Quadrant C |
| Plot type | Count rate plots | Images |
|---|---|---|
| Comparison with Poisson distribution Blue bars denote a histogram of data divided into 1 sec bins. Red curve is a Poisson curve with rate = median count rate of data. |
 |
 |
| Quadrant-wise count rates Data is divided into 100 sec bins |
 |
|
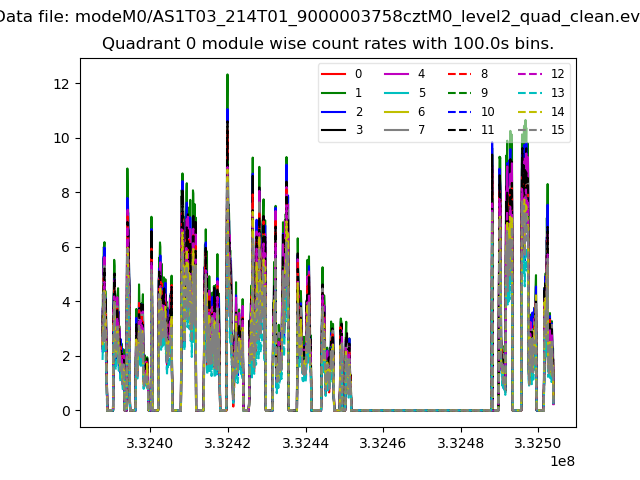
| Module-wise count rates for Quadrant A Data is divided into 100 sec bins |
 |
 |
| Module-wise count rates for Quadrant B Data is divided into 100 sec bins |
 |
 |
| Module-wise count rates for Quadrant C Data is divided into 100 sec bins |
 |
 |
| Module-wise count rates for Quadrant D Data is divided into 100 sec bins |
 |
 |
| Parameter | Plot |
|---|---|
| CZT HV Monitor | 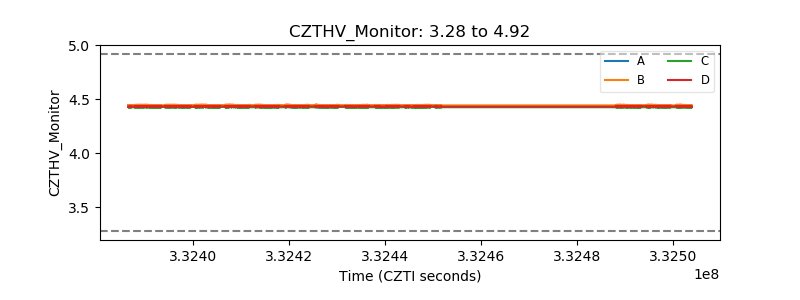 |
| D_VDD | 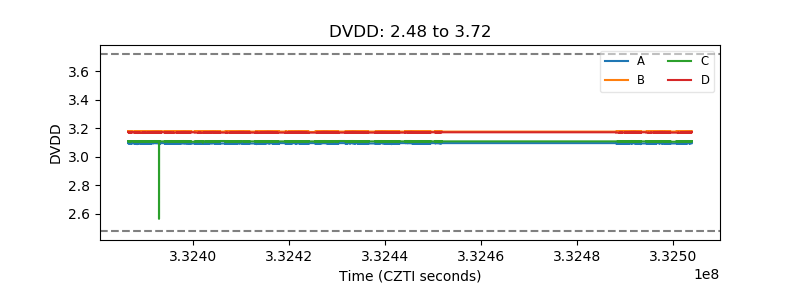 |
| Temperature 1 | 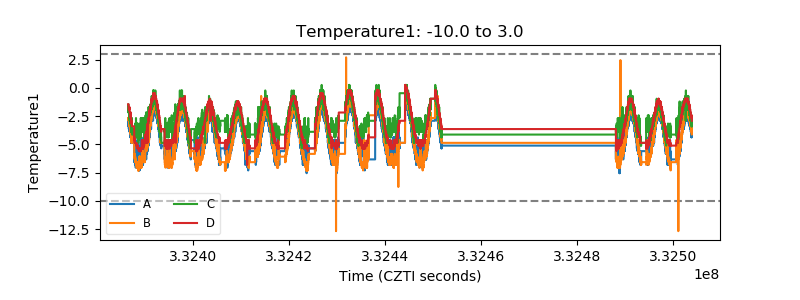 |
| Veto HV Monitor |  |
| Veto LLD | 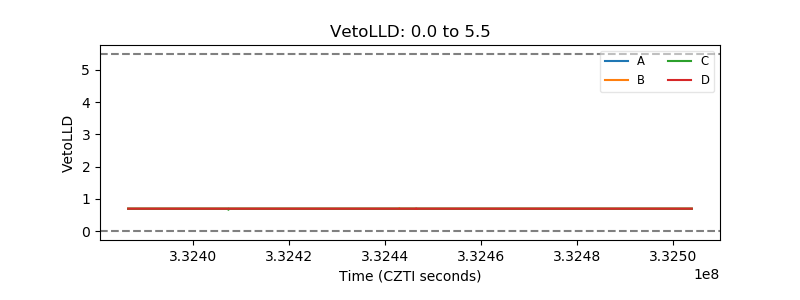 |
| Alpha Counter |  |
| _CPM_Rate | 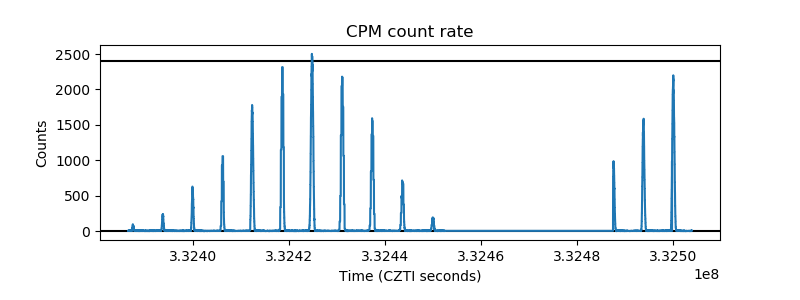 |
| CZT Counter |  |
| +2.5 Volts monitor | 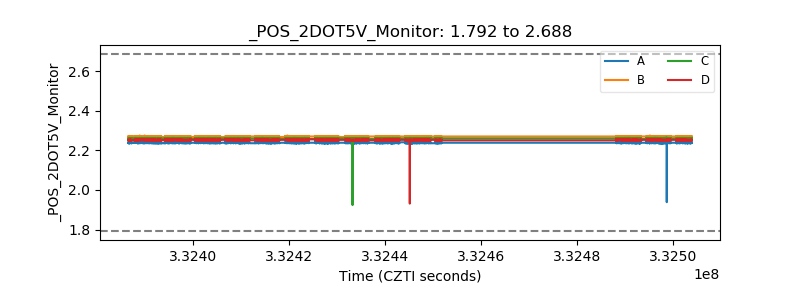 |
| +5 Volts monitor |  |
| _ROLL_ROT | 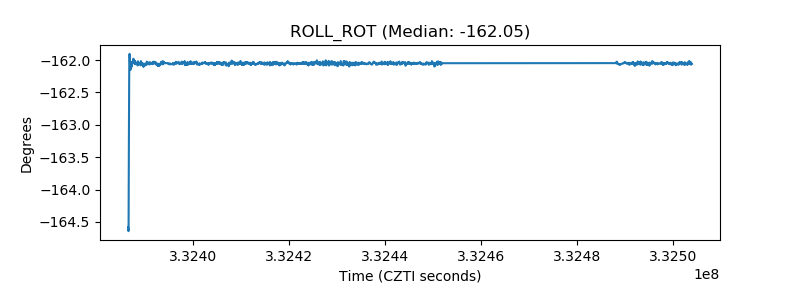 |
| _Roll_DEC | 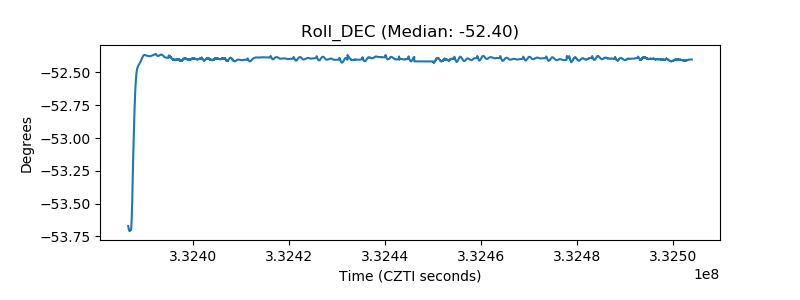 |
| _Roll_RA | 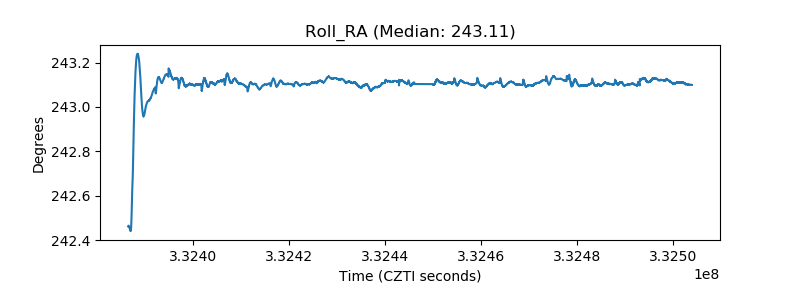 |
| Veto Counter |  |