| Param | Original file | Final file |
|---|---|---|
| Filename | modeM0/AS1A10_050T06_9000004092cztM0_level2_bc.evt | modeM0/AS1A10_050T06_9000004092cztM0_level2_quad_clean.evt |
| Size (bytes) | 2,272,248,000 | 645,480,000 |
| Size | 2.1 GB | 615.6 MB |
| Events in quadrant A | 11,029,552 | 4,186,170 |
| Events in quadrant B | 20,179,897 | 4,040,468 |
| Events in quadrant C | 10,675,890 | 4,025,578 |
| Events in quadrant D | 23,538,112 | 3,881,264 |
| Mode M0 | |||
|---|---|---|---|
| Quadrant | BADHDUFLAG | Total packets | Discarded packets |
| A | 0 | 106156 | 0 |
| B | 0 | 148802 | 0 |
| C | 0 | 105402 | 0 |
| D | 0 | 144405 | 0 |
| Mode SS | |||
|---|---|---|---|
| Quadrant | BADHDUFLAG | Total packets | Discarded packets |
| A | 0 | 1012 | 0 |
| B | 0 | 1012 | 0 |
| C | 0 | 1012 | 0 |
| D | 0 | 1012 | 0 |
| Mode M9 | |||
|---|---|---|---|
| Quadrant | BADHDUFLAG | Total packets | Discarded packets |
| A | 0 | 56 | 0 |
| B | 0 | 57 | 0 |
| C | 0 | 57 | 0 |
| D | 0 | 57 | 0 |
| Quadrant | Total seconds | Saturated seconds | Saturation percentage |
|---|---|---|---|
| A | 49777 | 621 | 1.247564% |
| B | 49777 | 5743 | 11.537457% |
| C | 49777 | 914 | 1.836189% |
| D | 49777 | 2902 | 5.830002% |
Noise dominated data is calculated using 1-second bins in cleaned event files. If a bin has >2000 counts, and if more than 50% of those come from <1% of pixels, then it is considered to be noise-dominated and hence unusable.
| Quadrant | # 1 sec bins | Bins with >0 counts | Bins with >2000 counts | High rate bins dominated by noise | Noise dominated (total time) | Noise dominated (detector-on time) | Marked lightcurve |
|---|---|---|---|---|---|---|---|
| A | 54972 | 49772 | 8 | 8 | 0.01% | 0.02% |  |
| B | 54972 | 49764 | 237 | 237 | 0.43% | 0.48% |  |
| C | 54973 | 49769 | 2 | 2 | 0.00% | 0.00% |  |
| D | 54972 | 49770 | 560 | 560 | 1.02% | 1.13% |  |
Top three noisy pixels from each quadrant. If the there are fewer than three noisy pixels in the level2.evt file, extra rows are filled as -1
| Pixel properties | Quadrant properties | ||||||
|---|---|---|---|---|---|---|---|
| Quadrant | DetID | PixID | Counts | Sigma | Mean | Median | Sigma |
| A | 15 | 174 | 432408 | 747.96 | 2647 | 2596 | 574.6 |
| A | 12 | 96 | 366946 | 634.04 | 2647 | 2596 | 574.6 |
| A | 13 | 254 | 69969 | 117.24 | 2647 | 2596 | 574.6 |
| B | 10 | 245 | 8754843 | 18391.66 | 2510 | 2446 | 475.9 |
| B | 10 | 246 | 1738437 | 3647.89 | 2510 | 2446 | 475.9 |
| B | 0 | 230 | 47481 | 94.63 | 2510 | 2446 | 475.9 |
| C | 15 | 208 | 285393 | 467.08 | 2558 | 2542 | 605.6 |
| C | 7 | 247 | 247891 | 405.15 | 2558 | 2542 | 605.6 |
| C | 3 | 233 | 144058 | 233.69 | 2558 | 2542 | 605.6 |
| D | 8 | 195 | 6909653 | 11785.96 | 2565 | 2488 | 586.1 |
| D | 1 | 52 | 6335232 | 10805.81 | 2565 | 2488 | 586.1 |
| D | 13 | 104 | 247013 | 417.24 | 2565 | 2488 | 586.1 |
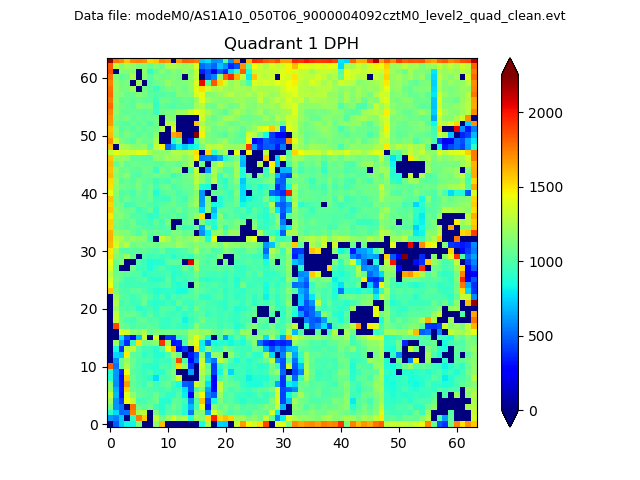
Histogram calculated using DETX and DETY for each event in the final _common_clean file
| Quadrant A |  |
 |
Quadrant B |
|---|---|---|---|
| Quadrant D | 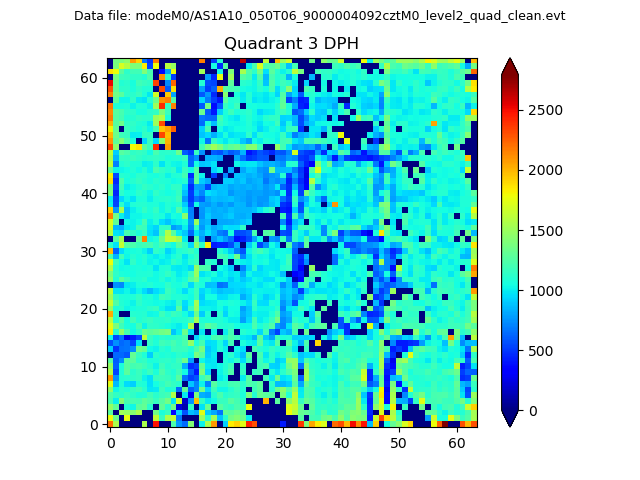 |
 |
Quadrant C |
| Plot type | Count rate plots | Images |
|---|---|---|
| Comparison with Poisson distribution Blue bars denote a histogram of data divided into 1 sec bins. Red curve is a Poisson curve with rate = median count rate of data. |
 |
 |
| Quadrant-wise count rates Data is divided into 100 sec bins |
 |
|
| Module-wise count rates for Quadrant A Data is divided into 100 sec bins |
 |
 |
| Module-wise count rates for Quadrant B Data is divided into 100 sec bins |
 |
 |
| Module-wise count rates for Quadrant C Data is divided into 100 sec bins |
 |
 |
| Module-wise count rates for Quadrant D Data is divided into 100 sec bins |
 |
 |
| Parameter | Plot |
|---|---|
| CZT HV Monitor |  |
| D_VDD |  |
| Temperature 1 |  |
| Veto HV Monitor |  |
| Veto LLD |  |
| Alpha Counter |  |
| _CPM_Rate |  |
| CZT Counter |  |
| +2.5 Volts monitor | 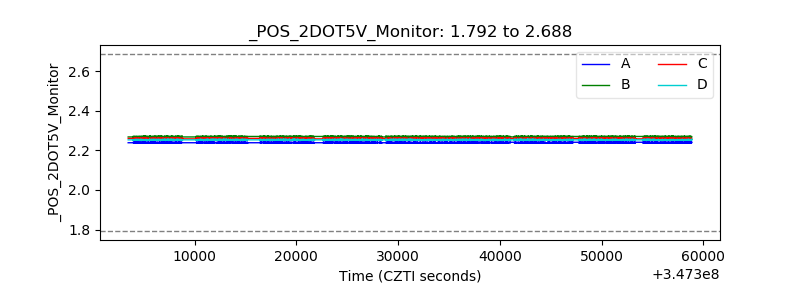 |
| +5 Volts monitor |  |
| _ROLL_ROT |  |
| _Roll_DEC |  |
| _Roll_RA |  |
| Veto Counter |  |