| Param | Original file | Final file |
|---|---|---|
| Filename | modeM0/AS1A10_123T08_9000004152cztM0_level2_bc.evt | modeM0/AS1A10_123T08_9000004152cztM0_level2_quad_clean.evt |
| Size (bytes) | 2,930,446,080 | 822,456,000 |
| Size | 2.7 GB | 784.4 MB |
| Events in quadrant A | 12,426,469 | 5,363,648 |
| Events in quadrant B | 12,973,495 | 5,556,410 |
| Events in quadrant C | 13,339,891 | 5,342,710 |
| Events in quadrant D | 45,998,661 | 4,605,494 |
| Mode SS | |||
|---|---|---|---|
| Quadrant | BADHDUFLAG | Total packets | Discarded packets |
| A | 0 | 1202 | 0 |
| B | 0 | 1202 | 0 |
| C | 0 | 1202 | 0 |
| D | 0 | 1202 | 0 |
| Mode M0 | |||
|---|---|---|---|
| Quadrant | BADHDUFLAG | Total packets | Discarded packets |
| A | 0 | 122412 | 0 |
| B | 0 | 124232 | 0 |
| C | 0 | 127264 | 0 |
| D | 0 | 237310 | 0 |
| Mode M9 | |||
|---|---|---|---|
| Quadrant | BADHDUFLAG | Total packets | Discarded packets |
| A | 0 | 97 | 0 |
| B | 0 | 97 | 0 |
| C | 0 | 97 | 0 |
| D | 0 | 97 | 0 |
| Quadrant | Total seconds | Saturated seconds | Saturation percentage |
|---|---|---|---|
| A | 58904 | 718 | 1.218933% |
| B | 58904 | 942 | 1.599212% |
| C | 58904 | 1525 | 2.588958% |
| D | 58904 | 11533 | 19.579315% |
Noise dominated data is calculated using 1-second bins in cleaned event files. If a bin has >2000 counts, and if more than 50% of those come from <1% of pixels, then it is considered to be noise-dominated and hence unusable.
| Quadrant | # 1 sec bins | Bins with >0 counts | Bins with >2000 counts | High rate bins dominated by noise | Noise dominated (total time) | Noise dominated (detector-on time) | Marked lightcurve |
|---|---|---|---|---|---|---|---|
| A | 68559 | 58907 | 2 | 2 | 0.00% | 0.00% |  |
| B | 68559 | 58905 | 23 | 23 | 0.03% | 0.04% |  |
| C | 68559 | 58907 | 2 | 2 | 0.00% | 0.00% |  |
| D | 68559 | 58906 | 4807 | 4807 | 7.01% | 8.16% |  |
Top three noisy pixels from each quadrant. If the there are fewer than three noisy pixels in the level2.evt file, extra rows are filled as -1
| Pixel properties | Quadrant properties | ||||||
|---|---|---|---|---|---|---|---|
| Quadrant | DetID | PixID | Counts | Sigma | Mean | Median | Sigma |
| A | 13 | 254 | 101145 | 145.37 | 3155 | 3105 | 674.4 |
| A | 12 | 96 | 92712 | 132.87 | 3155 | 3105 | 674.4 |
| A | 6 | 16 | 46822 | 64.82 | 3155 | 3105 | 674.4 |
| B | 10 | 245 | 211380 | 342.95 | 3226 | 3157 | 607.2 |
| B | 5 | 255 | 141810 | 228.36 | 3226 | 3157 | 607.2 |
| B | 15 | 33 | 69669 | 109.55 | 3226 | 3157 | 607.2 |
| C | 3 | 233 | 1197912 | 1648.37 | 3081 | 3074 | 724.9 |
| C | 2 | 114 | 113538 | 152.39 | 3081 | 3074 | 724.9 |
| C | 14 | 254 | 103171 | 138.09 | 3081 | 3074 | 724.9 |
| D | 8 | 195 | 18376727 | 27864.34 | 2840 | 2746 | 659.4 |
| D | 1 | 52 | 7851241 | 11902.33 | 2840 | 2746 | 659.4 |
| D | 7 | 80 | 6215963 | 9422.41 | 2840 | 2746 | 659.4 |
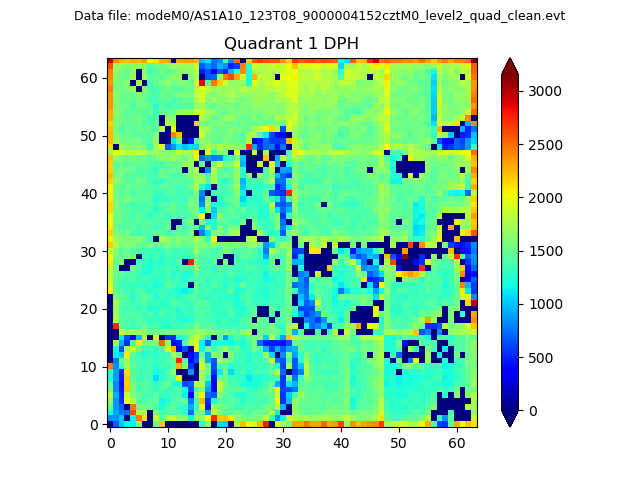
Histogram calculated using DETX and DETY for each event in the final _common_clean file
| Quadrant A |  |
 |
Quadrant B |
|---|---|---|---|
| Quadrant D | 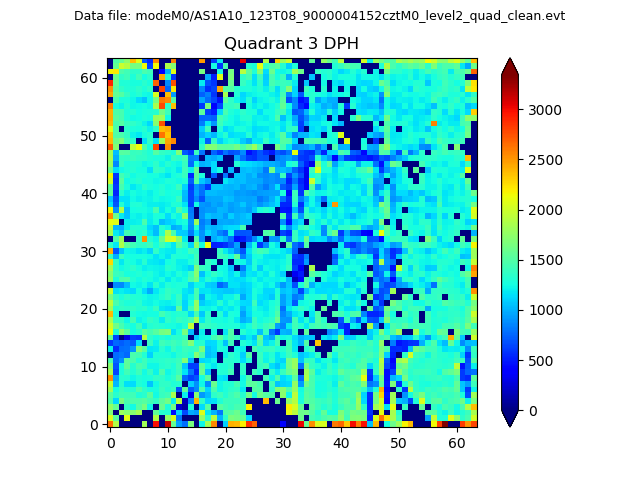 |
 |
Quadrant C |
| Plot type | Count rate plots | Images |
|---|---|---|
| Comparison with Poisson distribution Blue bars denote a histogram of data divided into 1 sec bins. Red curve is a Poisson curve with rate = median count rate of data. |
 |
 |
| Quadrant-wise count rates Data is divided into 100 sec bins |
 |
|
| Module-wise count rates for Quadrant A Data is divided into 100 sec bins |
 |
 |
| Module-wise count rates for Quadrant B Data is divided into 100 sec bins |
 |
 |
| Module-wise count rates for Quadrant C Data is divided into 100 sec bins |
 |
 |
| Module-wise count rates for Quadrant D Data is divided into 100 sec bins |
 |
 |
| Parameter | Plot |
|---|---|
| CZT HV Monitor |  |
| D_VDD |  |
| Temperature 1 |  |
| Veto HV Monitor |  |
| Veto LLD |  |
| Alpha Counter |  |
| _CPM_Rate |  |
| CZT Counter |  |
| +2.5 Volts monitor |  |
| +5 Volts monitor |  |
| _ROLL_ROT |  |
| _Roll_DEC |  |
| _Roll_RA |  |
| Veto Counter |  |