| Param | Original file | Final file |
|---|---|---|
| Filename | modeM0/AS1A10_102T11_9000004220cztM0_level2_bc.evt | modeM0/AS1A10_102T11_9000004220cztM0_level2_quad_clean.evt |
| Size (bytes) | 488,027,520 | 119,954,880 |
| Size | 465.4 MB | 114.4 MB |
| Events in quadrant A | 1,876,110 | 772,260 |
| Events in quadrant B | 1,995,201 | 785,443 |
| Events in quadrant C | 2,263,085 | 768,633 |
| Events in quadrant D | 8,025,872 | 681,632 |
| Mode M0 | |||
|---|---|---|---|
| Quadrant | BADHDUFLAG | Total packets | Discarded packets |
| A | 0 | 18712 | 0 |
| B | 0 | 19206 | 0 |
| C | 0 | 19855 | 0 |
| D | 0 | 41651 | 0 |
| Mode SS | |||
|---|---|---|---|
| Quadrant | BADHDUFLAG | Total packets | Discarded packets |
| A | 0 | 184 | 0 |
| B | 0 | 184 | 0 |
| C | 0 | 184 | 0 |
| D | 0 | 184 | 0 |
| Mode M9 | |||
|---|---|---|---|
| Quadrant | BADHDUFLAG | Total packets | Discarded packets |
| A | 0 | 16 | 0 |
| B | 0 | 16 | 0 |
| C | 0 | 16 | 0 |
| D | 0 | 16 | 0 |
| Quadrant | Total seconds | Saturated seconds | Saturation percentage |
|---|---|---|---|
| A | 8999 | 35 | 0.388932% |
| B | 8999 | 79 | 0.877875% |
| C | 8999 | 225 | 2.500278% |
| D | 9000 | 2342 | 26.022222% |
Noise dominated data is calculated using 1-second bins in cleaned event files. If a bin has >2000 counts, and if more than 50% of those come from <1% of pixels, then it is considered to be noise-dominated and hence unusable.
| Quadrant | # 1 sec bins | Bins with >0 counts | Bins with >2000 counts | High rate bins dominated by noise | Noise dominated (total time) | Noise dominated (detector-on time) | Marked lightcurve |
|---|---|---|---|---|---|---|---|
| A | 9804 | 8999 | 3 | 3 | 0.03% | 0.03% |  |
| B | 9804 | 8999 | 0 | 0 | 0.00% | 0.00% |  |
| C | 9804 | 8999 | 4 | 4 | 0.04% | 0.04% |  |
| D | 9805 | 8997 | 247 | 247 | 2.52% | 2.75% |  |
Top three noisy pixels from each quadrant. If the there are fewer than three noisy pixels in the level2.evt file, extra rows are filled as -1
| Pixel properties | Quadrant properties | ||||||
|---|---|---|---|---|---|---|---|
| Quadrant | DetID | PixID | Counts | Sigma | Mean | Median | Sigma |
| A | 15 | 174 | 106587 | 1045.66 | 454 | 445 | 101.5 |
| A | 13 | 254 | 17037 | 163.46 | 454 | 445 | 101.5 |
| A | 1 | 113 | 9313 | 87.36 | 454 | 445 | 101.5 |
| B | 5 | 255 | 110857 | 1215.46 | 458 | 448 | 90.8 |
| B | 0 | 229 | 63926 | 698.81 | 458 | 448 | 90.8 |
| B | 0 | 190 | 23953 | 258.76 | 458 | 448 | 90.8 |
| C | 10 | 9 | 333588 | 3088.61 | 443 | 440 | 107.9 |
| C | 3 | 233 | 198109 | 1832.59 | 443 | 440 | 107.9 |
| C | 2 | 114 | 17759 | 160.56 | 443 | 440 | 107.9 |
| D | 12 | 33 | 4509957 | 45525.82 | 410 | 394 | 99.1 |
| D | 1 | 52 | 1218596 | 12298.23 | 410 | 394 | 99.1 |
| D | 8 | 195 | 320068 | 3227.24 | 410 | 394 | 99.1 |
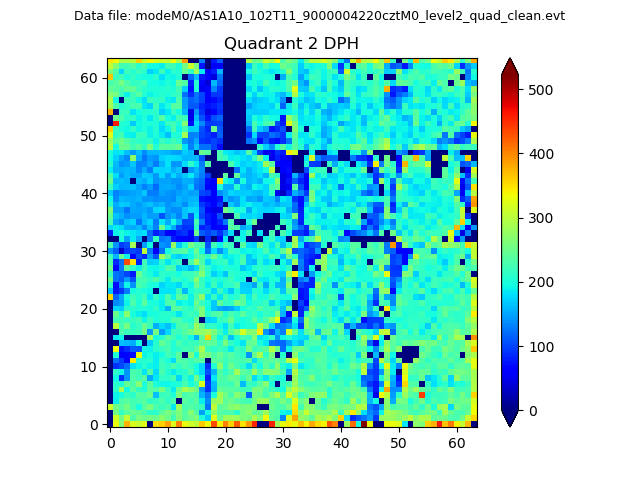
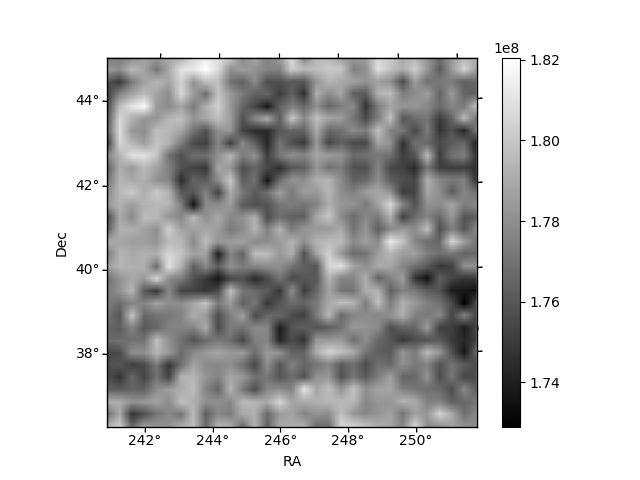
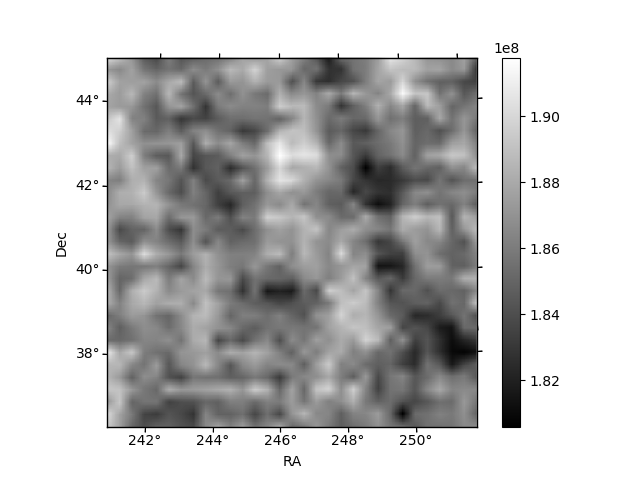
Histogram calculated using DETX and DETY for each event in the final _common_clean file
| Quadrant A | 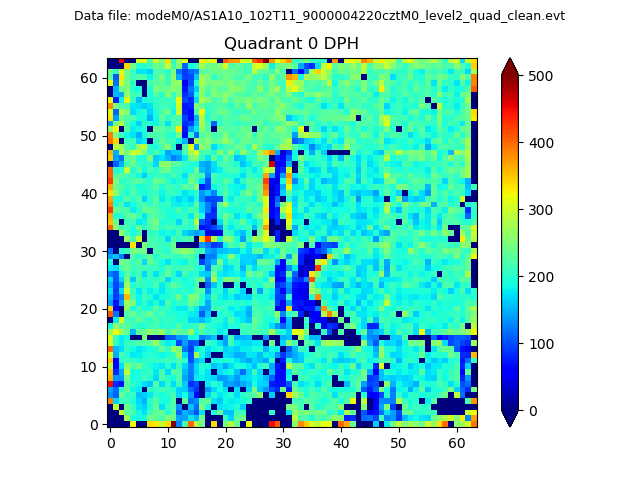 |
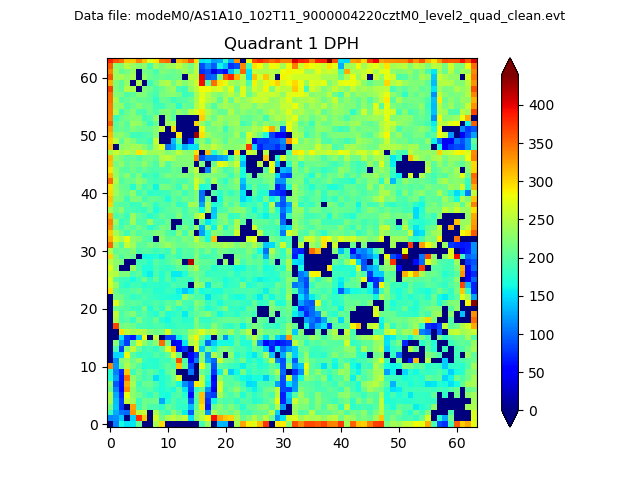 |
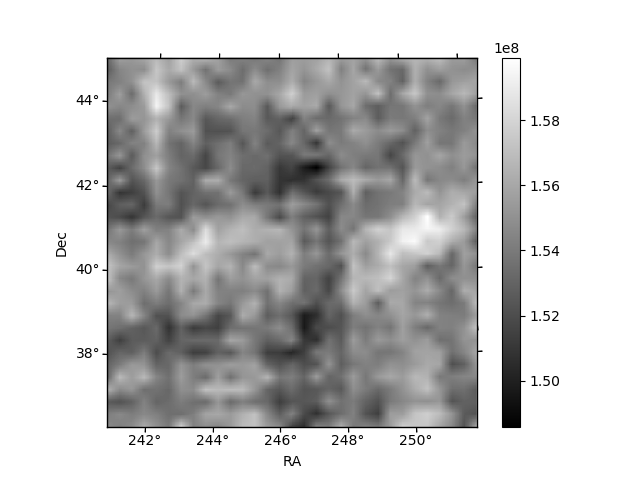
Quadrant B |
|---|---|---|---|
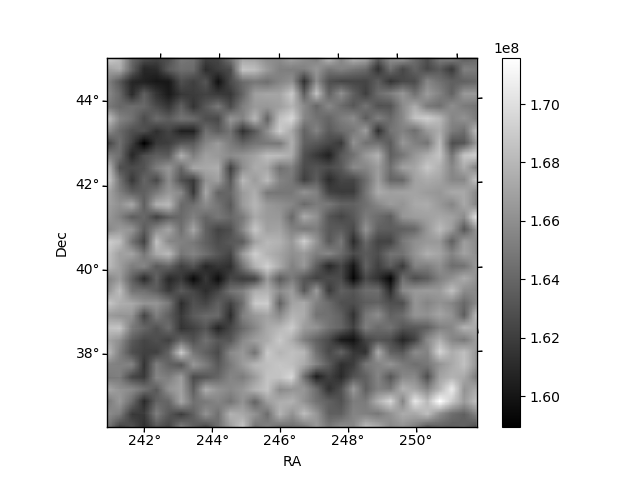
| Quadrant D | 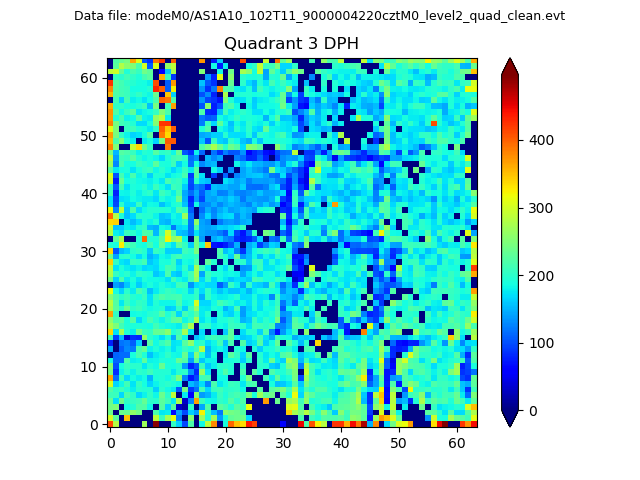 |
 |
Quadrant C |
| Plot type | Count rate plots | Images |
|---|---|---|
| Comparison with Poisson distribution Blue bars denote a histogram of data divided into 1 sec bins. Red curve is a Poisson curve with rate = median count rate of data. |
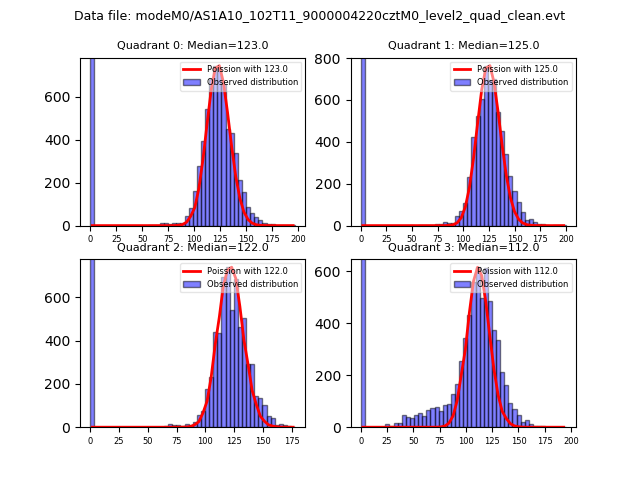 |
 |
| Quadrant-wise count rates Data is divided into 100 sec bins |
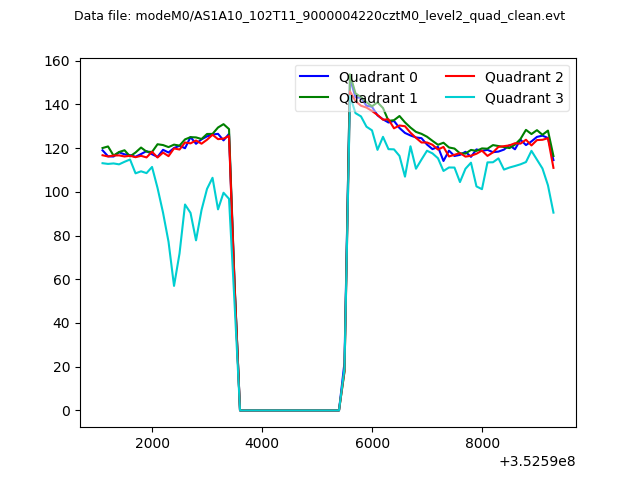 |
|
| Module-wise count rates for Quadrant A Data is divided into 100 sec bins |
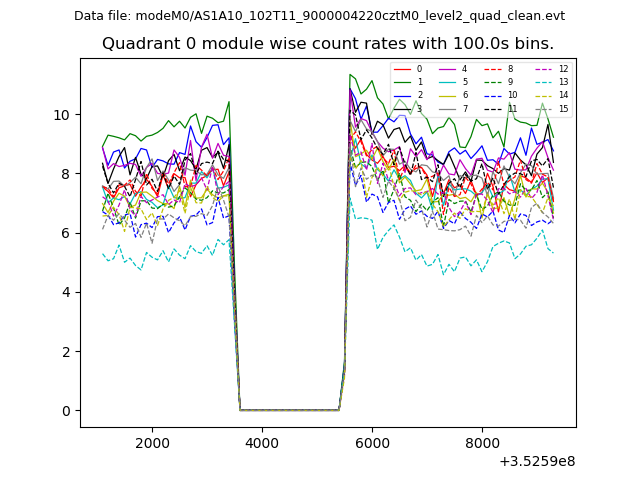 |
 |
| Module-wise count rates for Quadrant B Data is divided into 100 sec bins |
 |
 |
| Module-wise count rates for Quadrant C Data is divided into 100 sec bins |
 |
 |
| Module-wise count rates for Quadrant D Data is divided into 100 sec bins |
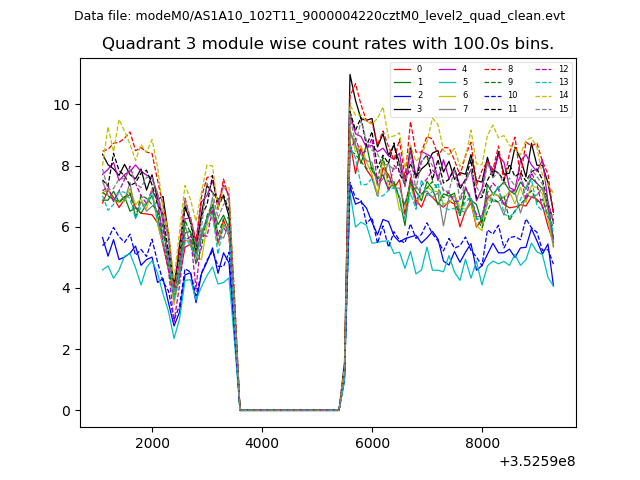 |
 |
| Parameter | Plot |
|---|---|
| CZT HV Monitor | 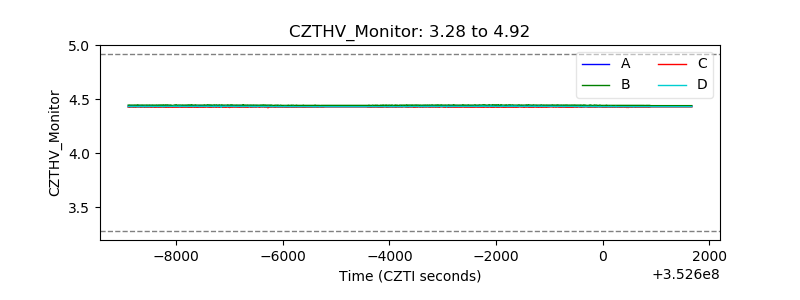 |
| D_VDD | 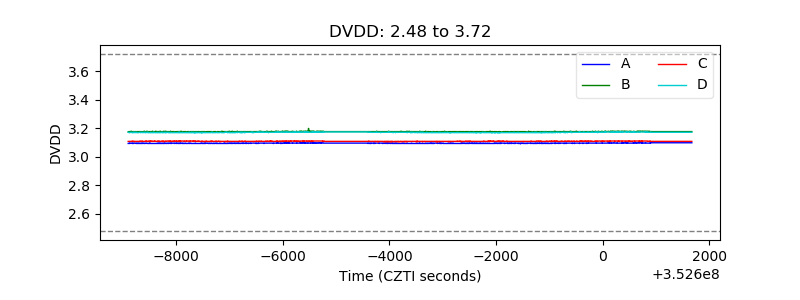 |
| Temperature 1 |  |
| Veto HV Monitor | 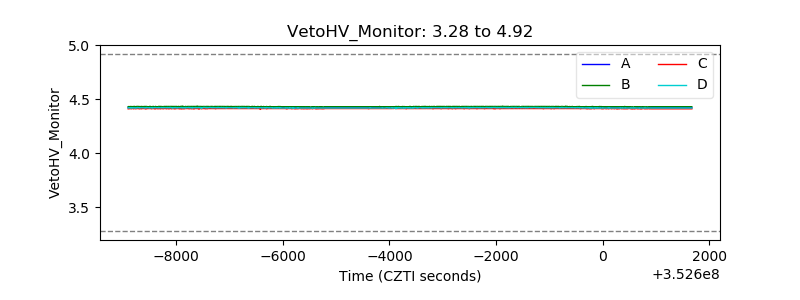 |
| Veto LLD |  |
| Alpha Counter | 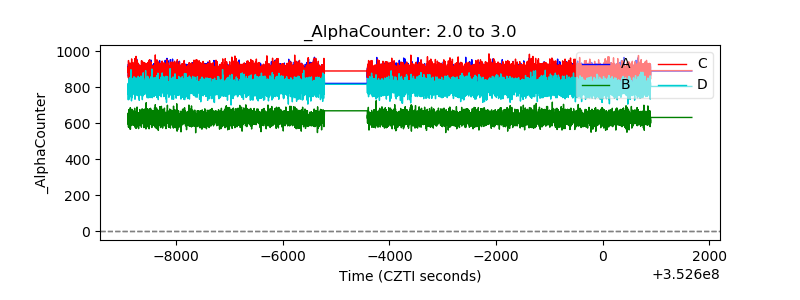 |
| _CPM_Rate |  |
| CZT Counter |  |
| +2.5 Volts monitor |  |
| +5 Volts monitor | 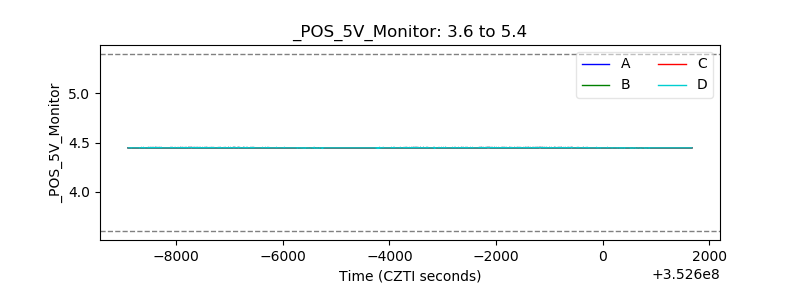 |
| _ROLL_ROT | 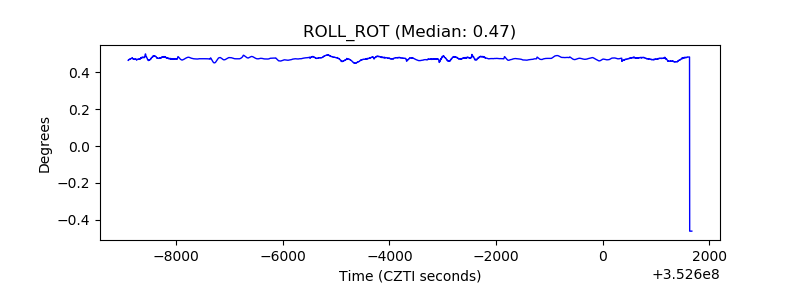 |
| _Roll_DEC | 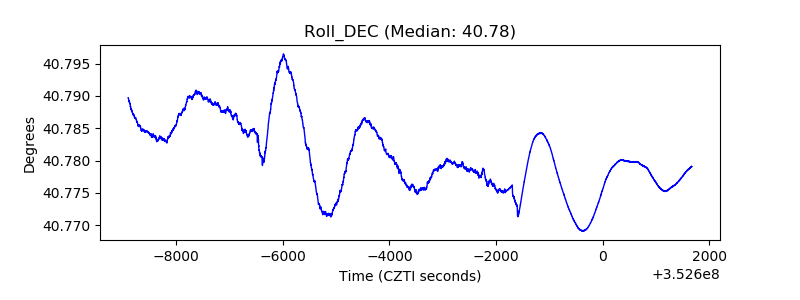 |
| _Roll_RA |  |
| Veto Counter | 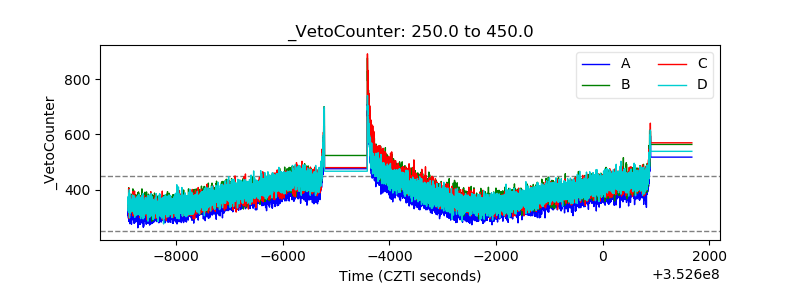 |