| Param | Original file | Final file |
|---|---|---|
| Filename | modeM0/AS1A10_053T15_9000004392cztM0_level2.fits | modeM0/AS1A10_053T15_9000004392cztM0_level2_quad_clean.evt |
| Size (bytes) | 240,632,640 | 233,349,120 |
| Size | 229.5 MB | 222.5 MB |
| Events in quadrant A | 1,516,508 | 1,436,009 |
| Events in quadrant B | 1,405,664 | 1,404,435 |
| Events in quadrant C | 1,434,886 | 1,330,588 |
| Events in quadrant D | 1,267,070 | 1,232,396 |
| Mode M9 | |||
|---|---|---|---|
| Quadrant | BADHDUFLAG | Total packets | Discarded packets |
| A | 0 | 31 | 0 |
| B | 0 | 31 | 0 |
| C | 0 | 31 | 0 |
| D | 0 | 31 | 0 |
| Mode SS | |||
|---|---|---|---|
| Quadrant | BADHDUFLAG | Total packets | Discarded packets |
| A | 0 | 490 | 0 |
| B | 0 | 490 | 0 |
| C | 0 | 490 | 0 |
| D | 0 | 490 | 0 |
| Mode M0 | |||
|---|---|---|---|
| Quadrant | BADHDUFLAG | Total packets | Discarded packets |
| A | 0 | 50346 | 0 |
| B | 0 | 74659 | 0 |
| C | 0 | 51990 | 0 |
| D | 0 | 69766 | 0 |
| Quadrant | Total seconds | Saturated seconds | Saturation percentage |
|---|---|---|---|
| A | 24176 | 383 | 1.584216% |
| B | 24176 | 789 | 3.263567% |
| C | 24176 | 653 | 2.701026% |
| D | 24176 | 1205 | 4.984282% |
Noise dominated data is calculated using 1-second bins in cleaned event files. If a bin has >2000 counts, and if more than 50% of those come from <1% of pixels, then it is considered to be noise-dominated and hence unusable.
| Quadrant | # 1 sec bins | Bins with >0 counts | Bins with >2000 counts | High rate bins dominated by noise | Noise dominated (total time) | Noise dominated (detector-on time) | Marked lightcurve |
|---|---|---|---|---|---|---|---|
| A | 27191 | 24176 | 0 | 0 | 0.00% | 0.00% |  |
| B | 27191 | 24177 | 0 | 0 | 0.00% | 0.00% |  |
| C | 27191 | 24176 | 0 | 0 | 0.00% | 0.00% |  |
| D | 27191 | 24172 | 0 | 0 | 0.00% | 0.00% | 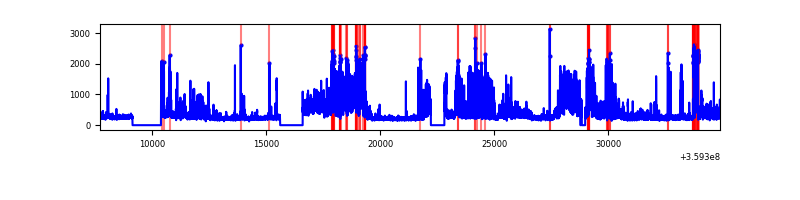 |
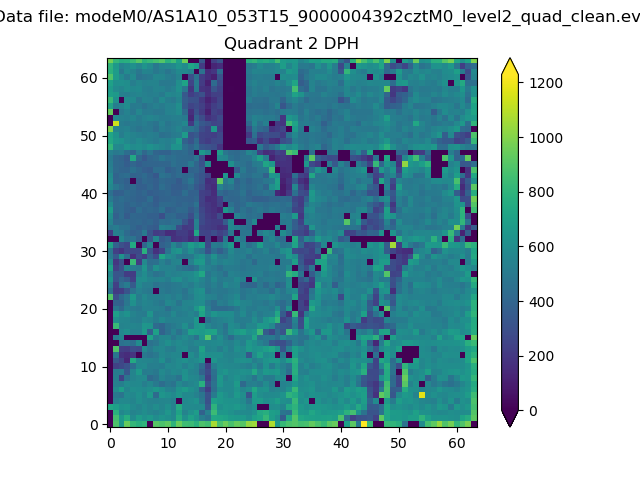
Top three noisy pixels from each quadrant. If the there are fewer than three noisy pixels in the level2.evt file, extra rows are filled as -1
| Pixel properties | Quadrant properties | ||||||
|---|---|---|---|---|---|---|---|
| Quadrant | DetID | PixID | Counts | Sigma | Mean | Median | Sigma |
| A | 0 | 29 | 1497 | 11.56 | 395 | 372 | 97.3 |
| A | 9 | 19 | 1198 | 8.49 | 395 | 372 | 97.3 |
| A | 7 | 110 | 1158 | 8.08 | 395 | 372 | 97.3 |
| B | 2 | 9 | 1145 | 10.59 | 371 | 355 | 74.6 |
| B | 3 | 80 | 934 | 7.76 | 371 | 355 | 74.6 |
| B | 2 | 8 | 930 | 7.71 | 371 | 355 | 74.6 |
| C | 9 | 209 | 996 | 6.57 | 379 | 354 | 97.8 |
| C | 12 | 241 | 983 | 6.43 | 379 | 354 | 97.8 |
| C | 3 | 126 | 955 | 6.15 | 379 | 354 | 97.8 |
| D | 15 | 46 | 928 | 6.12 | 361 | 329 | 97.7 |
| D | 3 | 14 | 893 | 5.77 | 361 | 329 | 97.7 |
| D | 6 | 38 | 864 | 5.47 | 361 | 329 | 97.7 |
Histogram calculated using DETX and DETY for each event in the final _common_clean file
| Quadrant A |  |
 |
Quadrant B |
|---|---|---|---|
| Quadrant D |  |
 |
Quadrant C |
| Plot type | Count rate plots | Images |
|---|---|---|
| Comparison with Poisson distribution Blue bars denote a histogram of data divided into 1 sec bins. Red curve is a Poisson curve with rate = median count rate of data. |
 |
 |
| Quadrant-wise count rates Data is divided into 100 sec bins |
 |
|
| Module-wise count rates for Quadrant A Data is divided into 100 sec bins |
 |
 |
| Module-wise count rates for Quadrant B Data is divided into 100 sec bins |
 |
 |
| Module-wise count rates for Quadrant C Data is divided into 100 sec bins |
 |
 |
| Module-wise count rates for Quadrant D Data is divided into 100 sec bins |
 |
 |
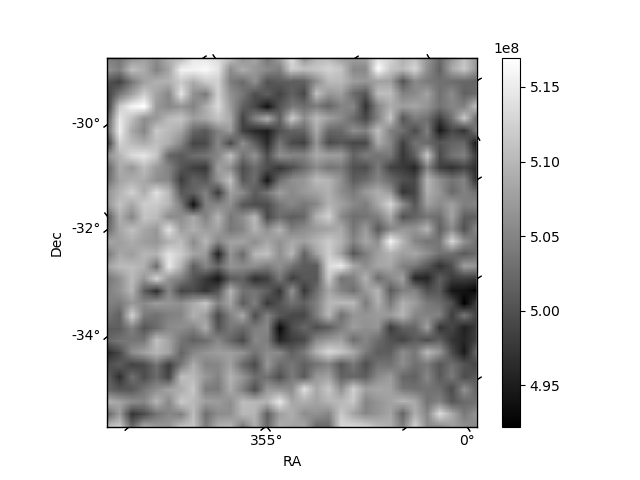
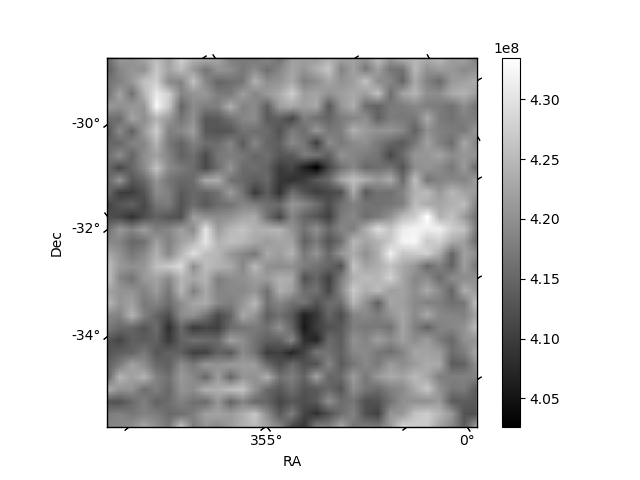
| Parameter | Plot |
|---|---|
| CZT HV Monitor |  |
| D_VDD |  |
| Temperature 1 |  |
| Veto HV Monitor |  |
| Veto LLD |  |
| Alpha Counter |  |
| _CPM_Rate | 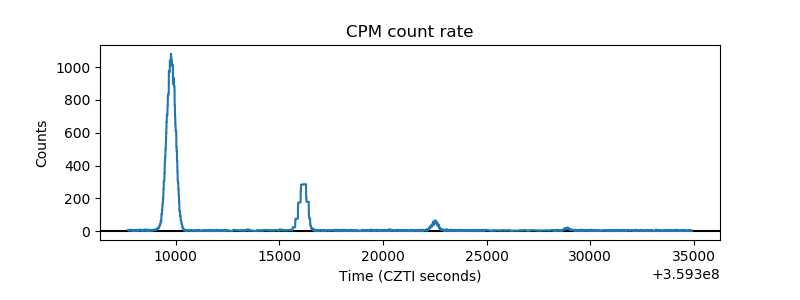 |
| CZT Counter |  |
| +2.5 Volts monitor |  |
| +5 Volts monitor |  |
| _ROLL_ROT |  |
| _Roll_DEC |  |
| _Roll_RA |  |
| Veto Counter |  |