| Param | Original file | Final file |
|---|---|---|
| Filename | modeM0/AS1T04_037T01_9000004644cztM0_level2_bc.evt | modeM0/AS1T04_037T01_9000004644cztM0_level2_quad_clean.evt |
| Size (bytes) | 1,229,716,800 | 247,299,840 |
| Size | 1.1 GB | 235.8 MB |
| Events in quadrant A | 9,168,488 | 1,522,329 |
| Events in quadrant B | 12,445,640 | 1,551,228 |
| Events in quadrant C | 5,191,568 | 1,530,401 |
| Events in quadrant D | 9,024,659 | 1,458,927 |
| Mode M9 | |||
|---|---|---|---|
| Quadrant | BADHDUFLAG | Total packets | Discarded packets |
| A | 0 | 13 | 0 |
| B | 0 | 13 | 0 |
| C | 0 | 13 | 0 |
| D | 0 | 13 | 0 |
| Mode M0 | |||
|---|---|---|---|
| Quadrant | BADHDUFLAG | Total packets | Discarded packets |
| A | 0 | 62448 | 0 |
| B | 0 | 71240 | 0 |
| C | 0 | 46899 | 0 |
| D | 0 | 58186 | 0 |
| Mode SS | |||
|---|---|---|---|
| Quadrant | BADHDUFLAG | Total packets | Discarded packets |
| A | 0 | 420 | 0 |
| B | 0 | 420 | 0 |
| C | 0 | 420 | 0 |
| D | 0 | 420 | 0 |
| Quadrant | Total seconds | Saturated seconds | Saturation percentage |
|---|---|---|---|
| A | 20705 | 2219 | 10.717218% |
| B | 20705 | 1369 | 6.611929% |
| C | 20705 | 815 | 3.936247% |
| D | 20705 | 960 | 4.636561% |
Noise dominated data is calculated using 1-second bins in cleaned event files. If a bin has >2000 counts, and if more than 50% of those come from <1% of pixels, then it is considered to be noise-dominated and hence unusable.
| Quadrant | # 1 sec bins | Bins with >0 counts | Bins with >2000 counts | High rate bins dominated by noise | Noise dominated (total time) | Noise dominated (detector-on time) | Marked lightcurve |
|---|---|---|---|---|---|---|---|
| A | 22040 | 20704 | 157 | 157 | 0.71% | 0.76% |  |
| B | 22040 | 20704 | 69 | 69 | 0.31% | 0.33% | 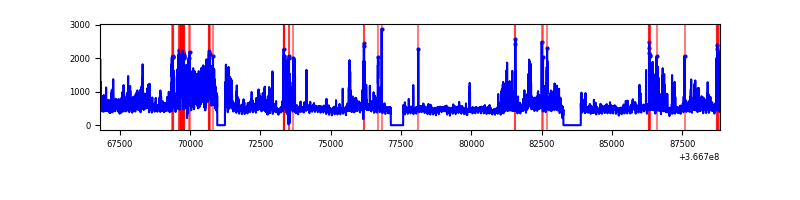 |
| C | 22040 | 20703 | 5 | 5 | 0.02% | 0.02% |  |
| D | 22040 | 20704 | 58 | 58 | 0.26% | 0.28% |  |
Top three noisy pixels from each quadrant. If the there are fewer than three noisy pixels in the level2.evt file, extra rows are filled as -1
| Pixel properties | Quadrant properties | ||||||
|---|---|---|---|---|---|---|---|
| Quadrant | DetID | PixID | Counts | Sigma | Mean | Median | Sigma |
| A | 0 | 13 | 5184032 | 22902.49 | 1023 | 1004 | 226.3 |
| A | 13 | 254 | 36206 | 155.55 | 1023 | 1004 | 226.3 |
| A | 13 | 6 | 27168 | 115.61 | 1023 | 1004 | 226.3 |
| B | 6 | 159 | 5438136 | 26447.15 | 1055 | 1026 | 205.6 |
| B | 10 | 245 | 1370232 | 6660.08 | 1055 | 1026 | 205.6 |
| B | 4 | 80 | 1187141 | 5769.49 | 1055 | 1026 | 205.6 |
| C | 0 | 10 | 995408 | 4110.54 | 1022 | 1020 | 241.9 |
| C | 14 | 254 | 93230 | 381.17 | 1022 | 1020 | 241.9 |
| C | 3 | 233 | 93223 | 381.14 | 1022 | 1020 | 241.9 |
| D | 8 | 195 | 2735266 | 11378.2 | 1035 | 1000 | 240.3 |
| D | 12 | 218 | 1599501 | 6651.9 | 1035 | 1000 | 240.3 |
| D | 12 | 227 | 205774 | 852.13 | 1035 | 1000 | 240.3 |
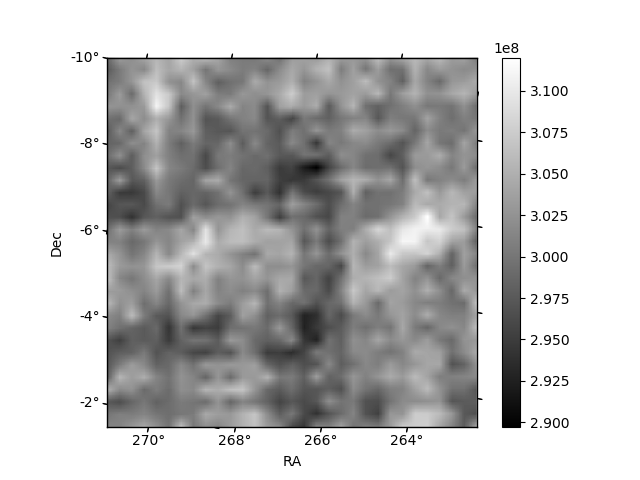
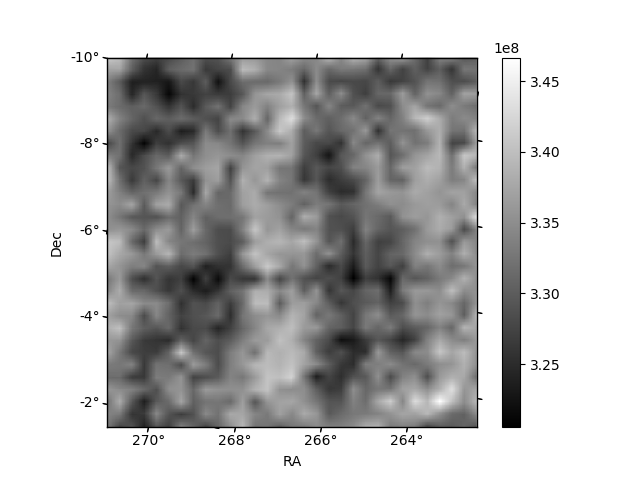
Histogram calculated using DETX and DETY for each event in the final _common_clean file
| Quadrant A |  |
 |
Quadrant B |
|---|---|---|---|
| Quadrant D |  |
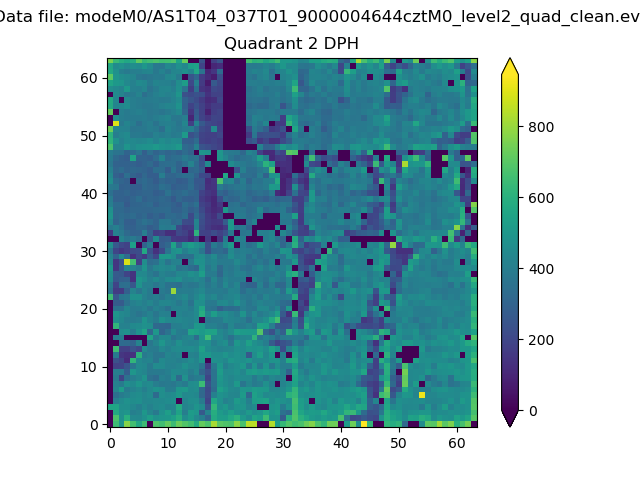 |
Quadrant C |
| Plot type | Count rate plots | Images |
|---|---|---|
| Comparison with Poisson distribution Blue bars denote a histogram of data divided into 1 sec bins. Red curve is a Poisson curve with rate = median count rate of data. |
 |
 |
| Quadrant-wise count rates Data is divided into 100 sec bins |
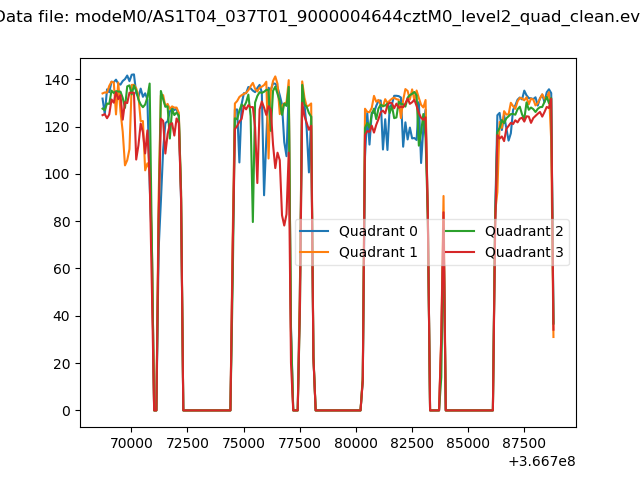 |
|
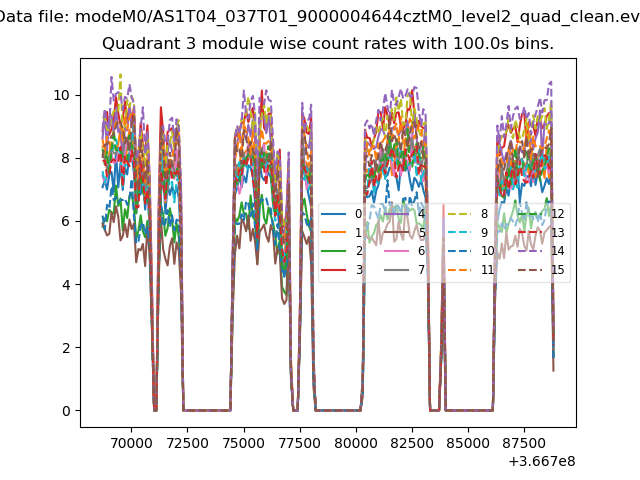
| Module-wise count rates for Quadrant A Data is divided into 100 sec bins |
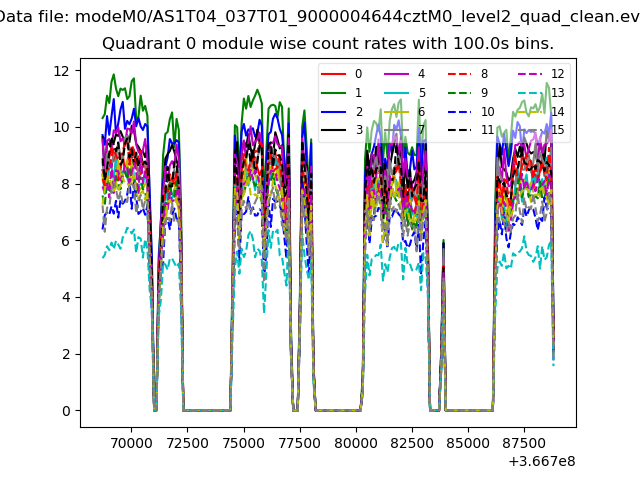 |
 |
| Module-wise count rates for Quadrant B Data is divided into 100 sec bins |
 |
 |
| Module-wise count rates for Quadrant C Data is divided into 100 sec bins |
 |
 |
| Module-wise count rates for Quadrant D Data is divided into 100 sec bins |
 |
 |
| Parameter | Plot |
|---|---|
| CZT HV Monitor |  |
| D_VDD | 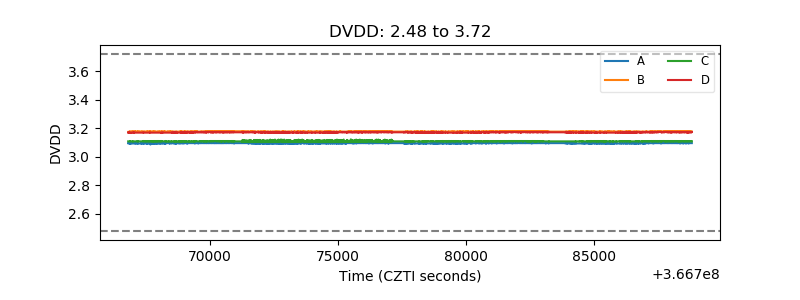 |
| Temperature 1 |  |
| Veto HV Monitor | 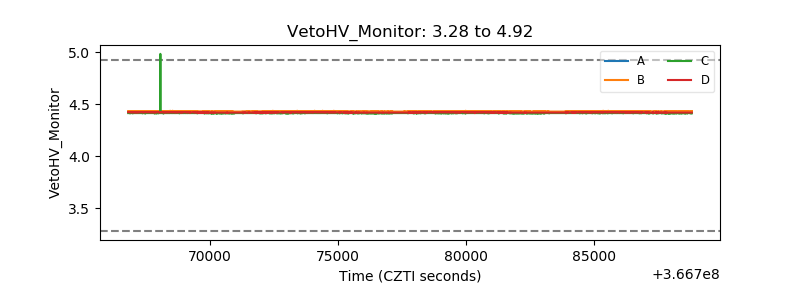 |
| Veto LLD |  |
| Alpha Counter |  |
| _CPM_Rate |  |
| CZT Counter |  |
| +2.5 Volts monitor |  |
| +5 Volts monitor |  |
| _ROLL_ROT | 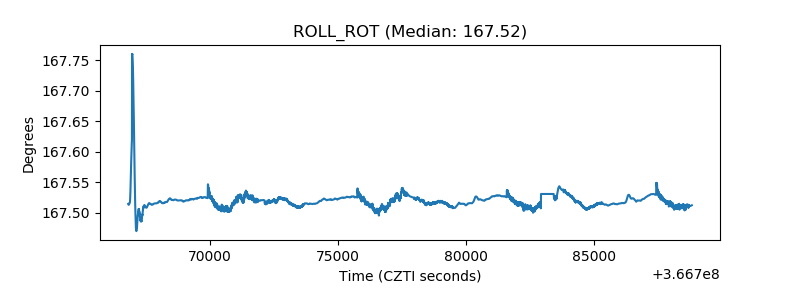 |
| _Roll_DEC |  |
| _Roll_RA | 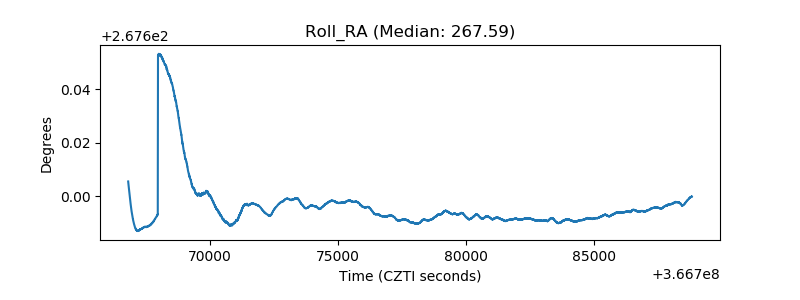 |
| Veto Counter |  |