| Param | Original file | Final file |
|---|---|---|
| Filename | modeM0/AS1A11_088T01_9000004738cztM0_level2_bc.evt | modeM0/AS1A11_088T01_9000004738cztM0_level2_quad_clean.evt |
| Size (bytes) | 401,768,640 | 84,395,520 |
| Size | 383.2 MB | 80.5 MB |
| Events in quadrant A | 1,401,919 | 549,167 |
| Events in quadrant B | 1,962,733 | 555,244 |
| Events in quadrant C | 1,767,268 | 558,292 |
| Events in quadrant D | 6,598,628 | 452,038 |
| Mode SS | |||
|---|---|---|---|
| Quadrant | BADHDUFLAG | Total packets | Discarded packets |
| A | 0 | 132 | 0 |
| B | 0 | 132 | 0 |
| C | 0 | 132 | 0 |
| D | 0 | 132 | 0 |
| Mode M0 | |||
|---|---|---|---|
| Quadrant | BADHDUFLAG | Total packets | Discarded packets |
| A | 0 | 13174 | 0 |
| B | 0 | 15888 | 0 |
| C | 0 | 14145 | 0 |
| D | 0 | 34028 | 0 |
| Mode M9 | |||
|---|---|---|---|
| Quadrant | BADHDUFLAG | Total packets | Discarded packets |
| A | 0 | 19 | 0 |
| B | 0 | 19 | 0 |
| C | 0 | 19 | 0 |
| D | 0 | 19 | 0 |
| Quadrant | Total seconds | Saturated seconds | Saturation percentage |
|---|---|---|---|
| A | 6305 | 44 | 0.697859% |
| B | 6305 | 316 | 5.011895% |
| C | 6305 | 137 | 2.172879% |
| D | 6305 | 2396 | 38.001586% |
Noise dominated data is calculated using 1-second bins in cleaned event files. If a bin has >2000 counts, and if more than 50% of those come from <1% of pixels, then it is considered to be noise-dominated and hence unusable.
| Quadrant | # 1 sec bins | Bins with >0 counts | Bins with >2000 counts | High rate bins dominated by noise | Noise dominated (total time) | Noise dominated (detector-on time) | Marked lightcurve |
|---|---|---|---|---|---|---|---|
| A | 7618 | 6305 | 15 | 15 | 0.20% | 0.24% | 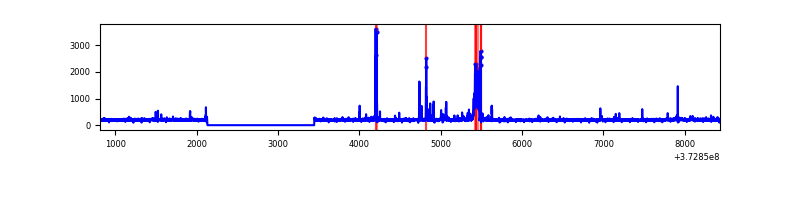 |
| B | 7618 | 6305 | 4 | 4 | 0.05% | 0.06% | 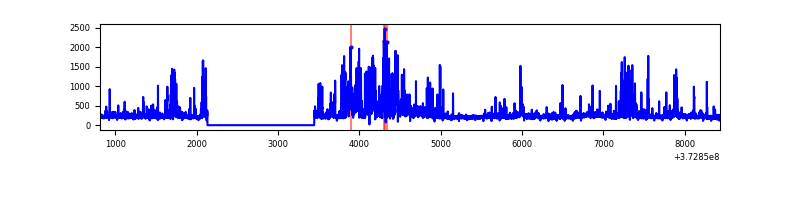 |
| C | 7618 | 6305 | 63 | 63 | 0.83% | 1.00% |  |
| D | 7618 | 6302 | 585 | 585 | 7.68% | 9.28% | 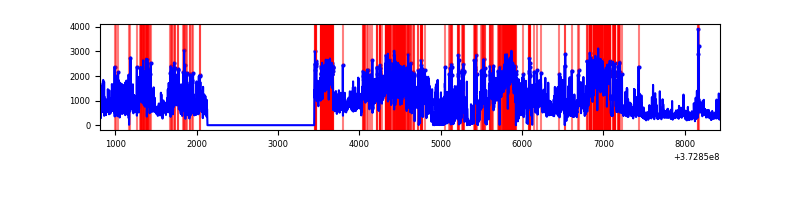 |
Top three noisy pixels from each quadrant. If the there are fewer than three noisy pixels in the level2.evt file, extra rows are filled as -1
| Pixel properties | Quadrant properties | ||||||
|---|---|---|---|---|---|---|---|
| Quadrant | DetID | PixID | Counts | Sigma | Mean | Median | Sigma |
| A | 9 | 143 | 133263 | 1824.45 | 314 | 309 | 72.9 |
| A | 0 | 135 | 23675 | 320.64 | 314 | 309 | 72.9 |
| A | 13 | 254 | 11607 | 155.04 | 314 | 309 | 72.9 |
| B | 5 | 172 | 451690 | 6855.77 | 311 | 304 | 65.8 |
| B | 0 | 219 | 68547 | 1036.49 | 311 | 304 | 65.8 |
| B | 0 | 197 | 65736 | 993.8 | 311 | 304 | 65.8 |
| C | 3 | 233 | 373522 | 5036.23 | 309 | 305 | 74.1 |
| C | 0 | 10 | 102325 | 1376.67 | 309 | 305 | 74.1 |
| C | 1 | 241 | 36623 | 490.08 | 309 | 305 | 74.1 |
| D | 12 | 227 | 1677044 | 25129.99 | 248 | 242 | 66.7 |
| D | 8 | 195 | 1376544 | 20626.44 | 248 | 242 | 66.7 |
| D | 2 | 249 | 654682 | 9808.0 | 248 | 242 | 66.7 |
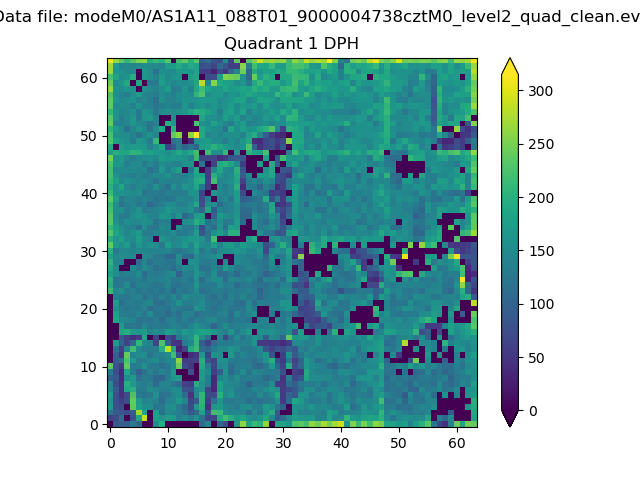
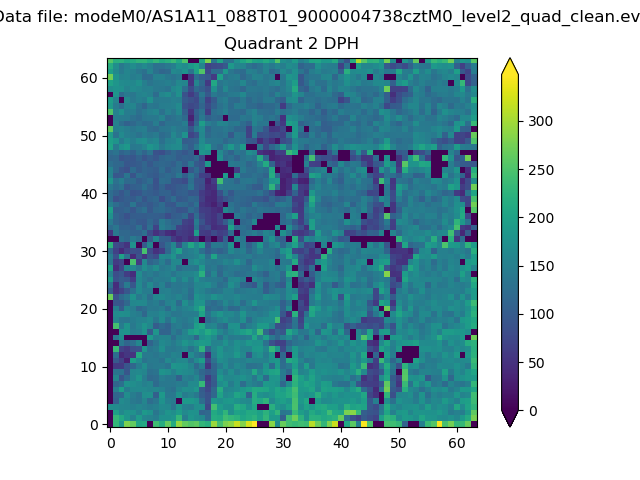
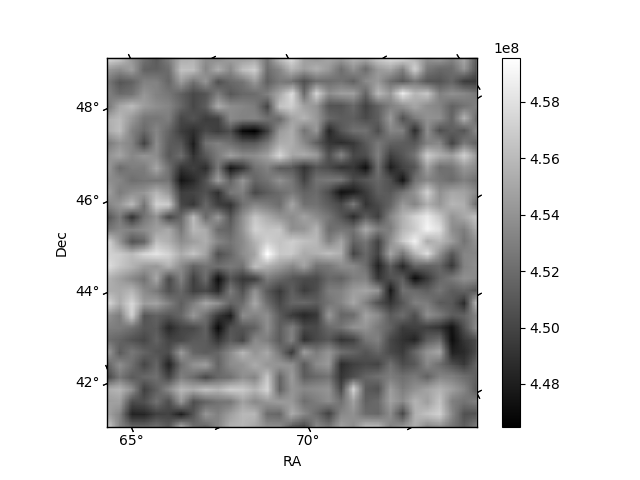
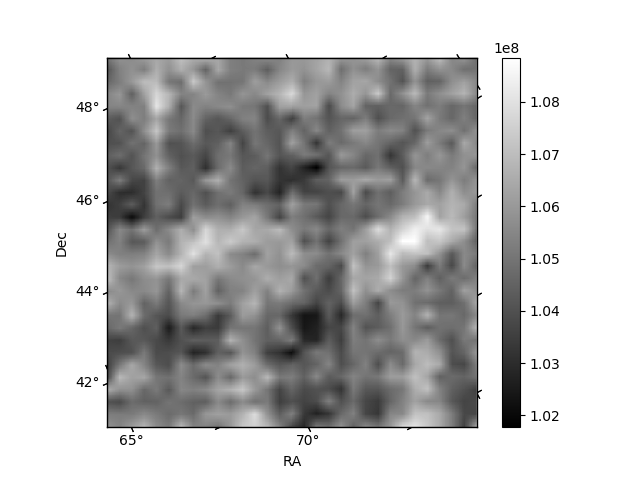
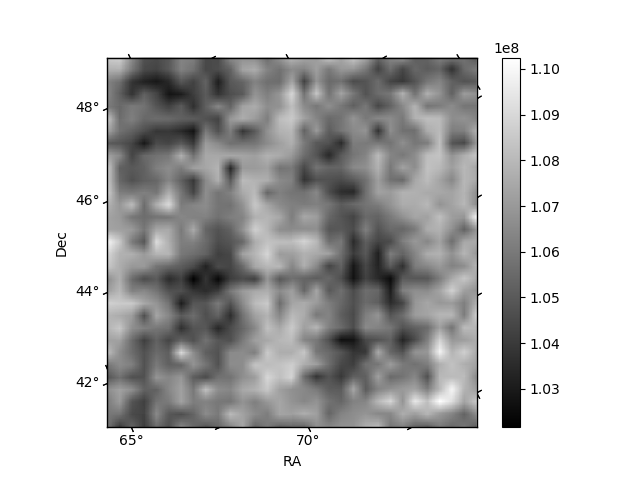
Histogram calculated using DETX and DETY for each event in the final _common_clean file
| Quadrant A | 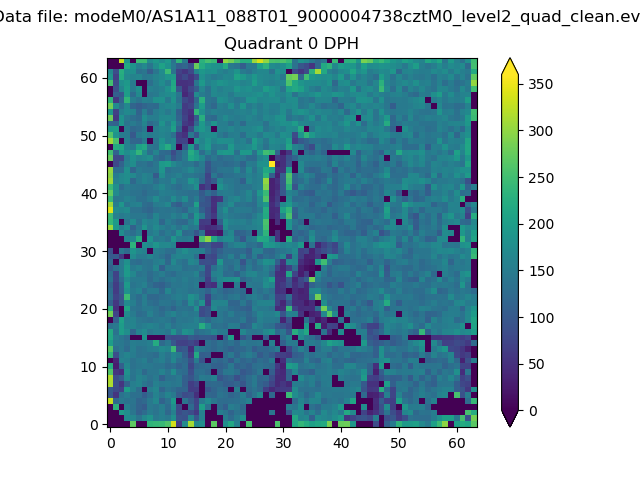 |
 |
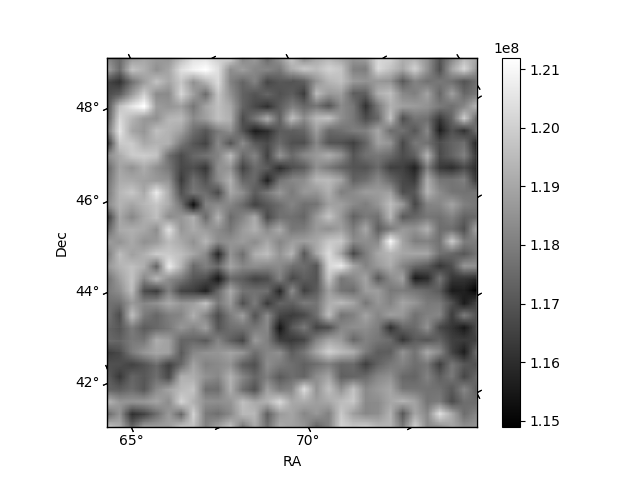
Quadrant B |
|---|---|---|---|
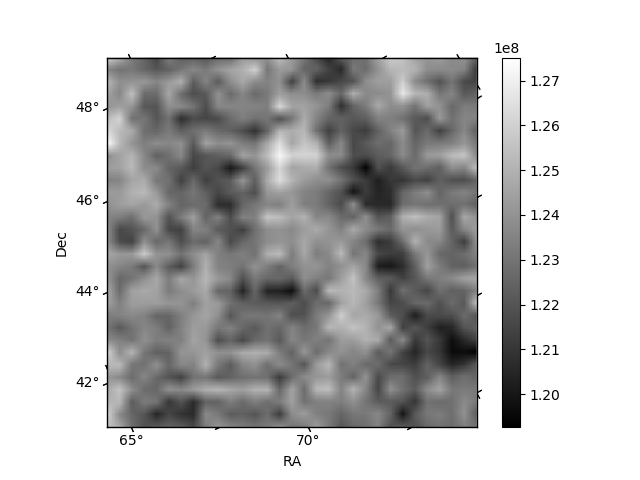
| Quadrant D | 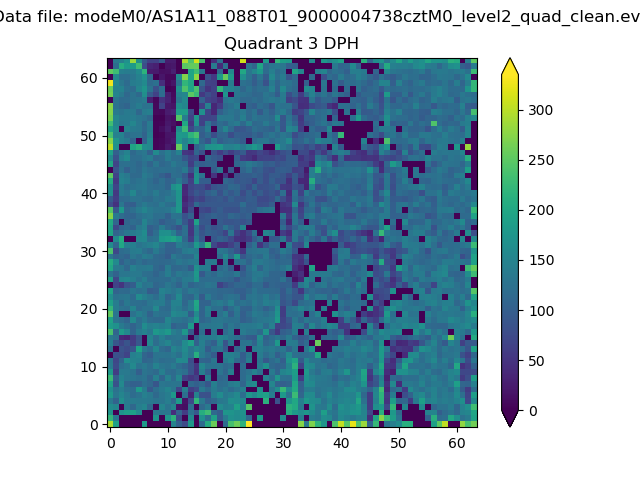 |
 |
Quadrant C |
| Plot type | Count rate plots | Images |
|---|---|---|
| Comparison with Poisson distribution Blue bars denote a histogram of data divided into 1 sec bins. Red curve is a Poisson curve with rate = median count rate of data. |
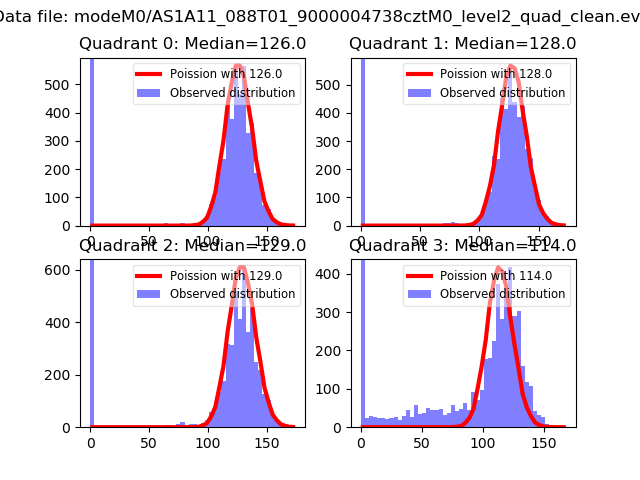 |
 |
| Quadrant-wise count rates Data is divided into 100 sec bins |
 |
|
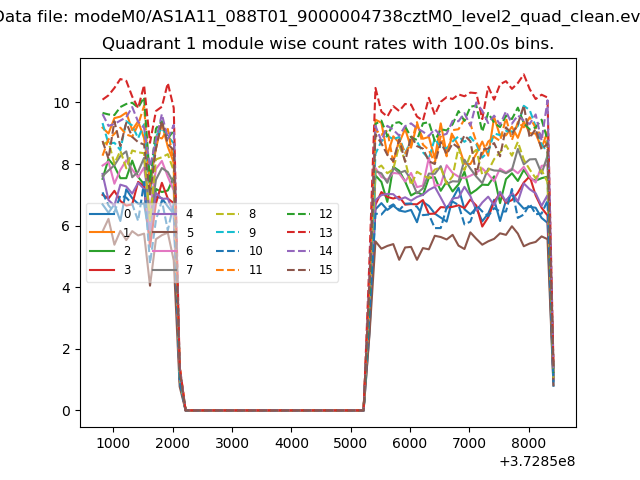
| Module-wise count rates for Quadrant A Data is divided into 100 sec bins |
 |
 |
| Module-wise count rates for Quadrant B Data is divided into 100 sec bins |
 |
 |
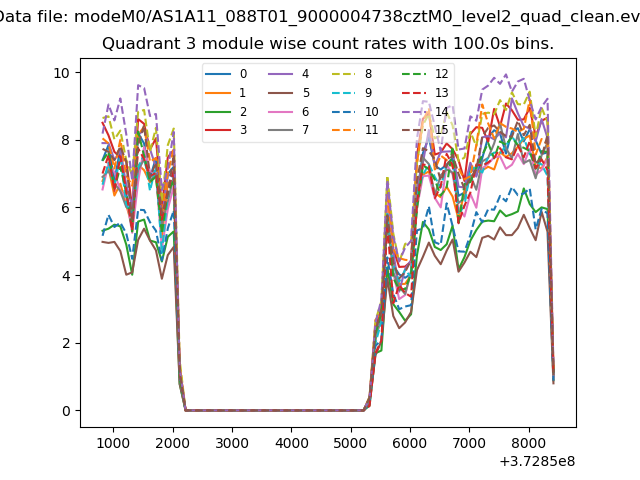
| Module-wise count rates for Quadrant C Data is divided into 100 sec bins |
 |
 |
| Module-wise count rates for Quadrant D Data is divided into 100 sec bins |
 |
 |
| Parameter | Plot |
|---|---|
| CZT HV Monitor | 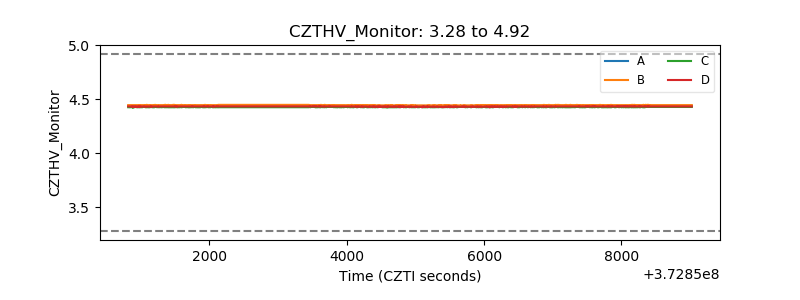 |
| D_VDD | 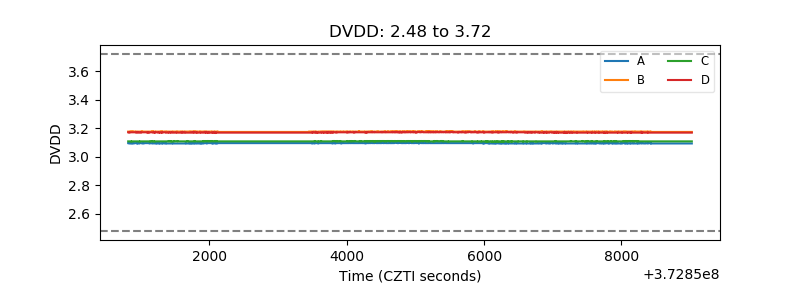 |
| Temperature 1 | 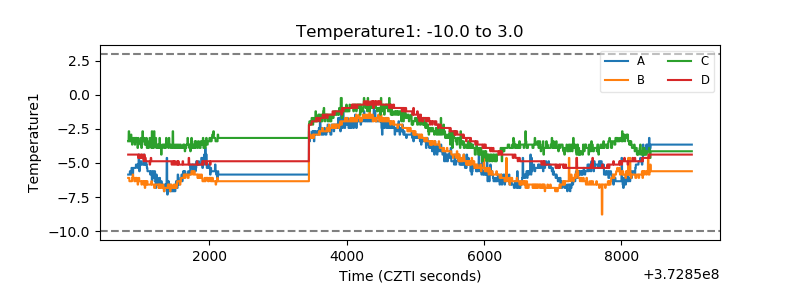 |
| Veto HV Monitor |  |
| Veto LLD | 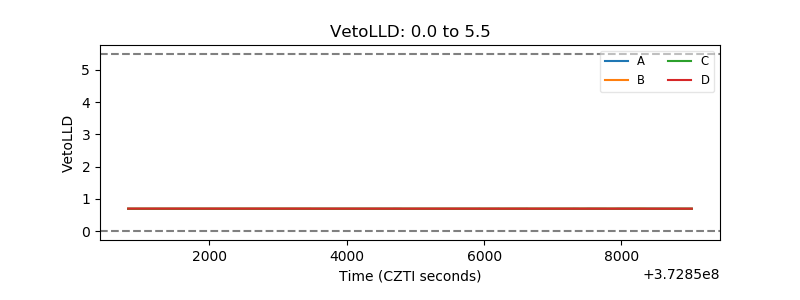 |
| Alpha Counter |  |
| _CPM_Rate |  |
| CZT Counter | 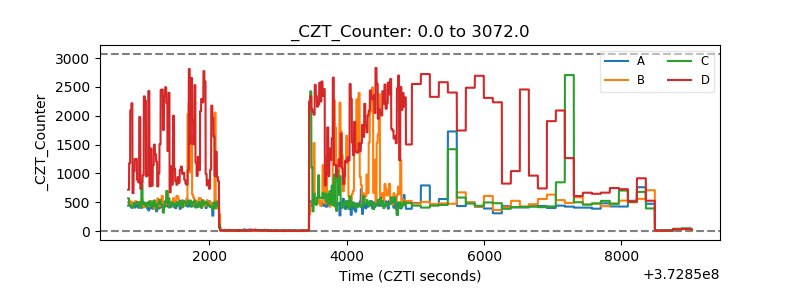 |
| +2.5 Volts monitor |  |
| +5 Volts monitor |  |
| _ROLL_ROT |  |
| _Roll_DEC | 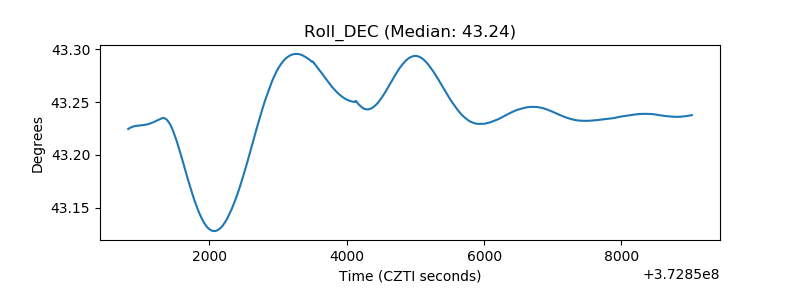 |
| _Roll_RA | 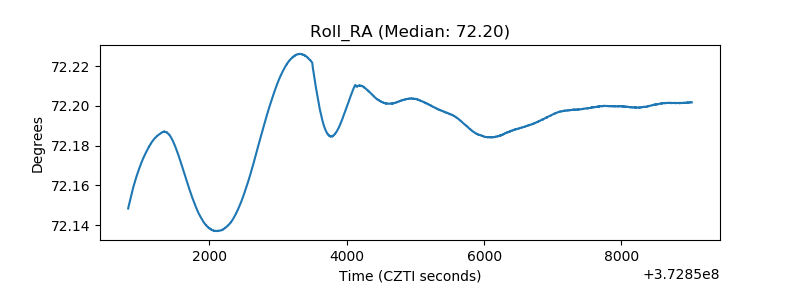 |
| Veto Counter | 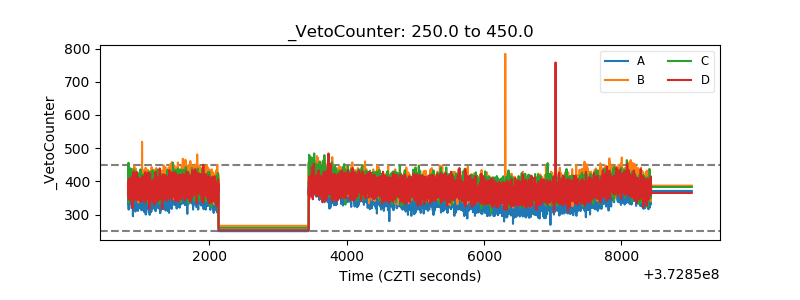 |