| Param | Original file | Final file |
|---|---|---|
| Filename | modeM0/AS1C06_010T05_9000004736cztM0_level2_bc.evt | modeM0/AS1C06_010T05_9000004736cztM0_level2_quad_clean.evt |
| Size (bytes) | 1,276,352,640 | 349,479,360 |
| Size | 1.2 GB | 333.3 MB |
| Events in quadrant A | 3,980,013 | 2,434,892 |
| Events in quadrant B | 6,625,577 | 2,438,245 |
| Events in quadrant C | 7,892,489 | 2,372,445 |
| Events in quadrant D | 18,874,065 | 2,041,688 |
| Mode M9 | |||
|---|---|---|---|
| Quadrant | BADHDUFLAG | Total packets | Discarded packets |
| A | 0 | 75 | 0 |
| B | 0 | 75 | 0 |
| C | 0 | 75 | 0 |
| D | 0 | 75 | 0 |
| Mode M0 | |||
|---|---|---|---|
| Quadrant | BADHDUFLAG | Total packets | Discarded packets |
| A | 0 | 38090 | 0 |
| B | 0 | 49630 | 0 |
| C | 0 | 51160 | 0 |
| D | 0 | 89047 | 0 |
| Mode SS | |||
|---|---|---|---|
| Quadrant | BADHDUFLAG | Total packets | Discarded packets |
| A | 0 | 388 | 0 |
| B | 0 | 388 | 0 |
| C | 0 | 388 | 0 |
| D | 0 | 388 | 0 |
| Quadrant | Total seconds | Saturated seconds | Saturation percentage |
|---|---|---|---|
| A | 18806 | 40 | 0.212698% |
| B | 18806 | 1136 | 6.040625% |
| C | 18806 | 470 | 2.499202% |
| D | 18806 | 4303 | 22.880995% |
Noise dominated data is calculated using 1-second bins in cleaned event files. If a bin has >2000 counts, and if more than 50% of those come from <1% of pixels, then it is considered to be noise-dominated and hence unusable.
| Quadrant | # 1 sec bins | Bins with >0 counts | Bins with >2000 counts | High rate bins dominated by noise | Noise dominated (total time) | Noise dominated (detector-on time) | Marked lightcurve |
|---|---|---|---|---|---|---|---|
| A | 26426 | 18806 | 11 | 11 | 0.04% | 0.06% | 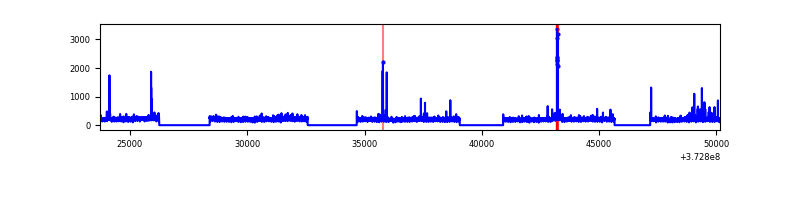 |
| B | 26426 | 18806 | 52 | 52 | 0.20% | 0.28% | 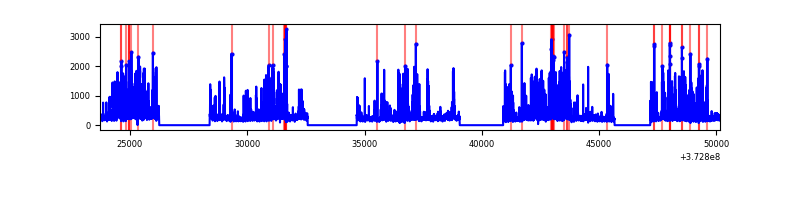 |
| C | 26426 | 18806 | 77 | 77 | 0.29% | 0.41% |  |
| D | 26426 | 18807 | 1356 | 1356 | 5.13% | 7.21% | 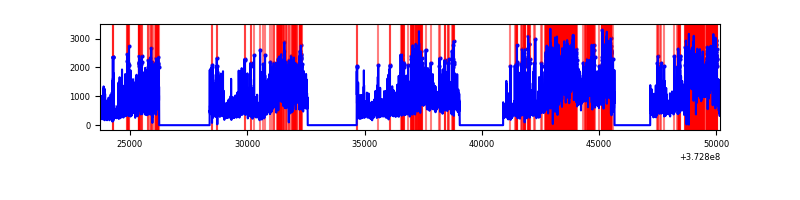 |
Top three noisy pixels from each quadrant. If the there are fewer than three noisy pixels in the level2.evt file, extra rows are filled as -1
| Pixel properties | Quadrant properties | ||||||
|---|---|---|---|---|---|---|---|
| Quadrant | DetID | PixID | Counts | Sigma | Mean | Median | Sigma |
| A | 9 | 143 | 103639 | 476.21 | 976 | 963 | 215.6 |
| A | 13 | 254 | 36000 | 162.5 | 976 | 963 | 215.6 |
| A | 13 | 6 | 25742 | 114.92 | 976 | 963 | 215.6 |
| B | 5 | 172 | 1728568 | 8841.12 | 973 | 954 | 195.4 |
| B | 0 | 197 | 225911 | 1151.22 | 973 | 954 | 195.4 |
| B | 8 | 128 | 186022 | 947.09 | 973 | 954 | 195.4 |
| C | 3 | 233 | 2858115 | 13277.79 | 941 | 938 | 215.2 |
| C | 9 | 160 | 891696 | 4139.5 | 941 | 938 | 215.2 |
| C | 0 | 10 | 242899 | 1124.43 | 941 | 938 | 215.2 |
| D | 8 | 195 | 4506562 | 19926.12 | 863 | 842 | 226.1 |
| D | 12 | 227 | 3510847 | 15522.66 | 863 | 842 | 226.1 |
| D | 7 | 80 | 1765881 | 7805.72 | 863 | 842 | 226.1 |
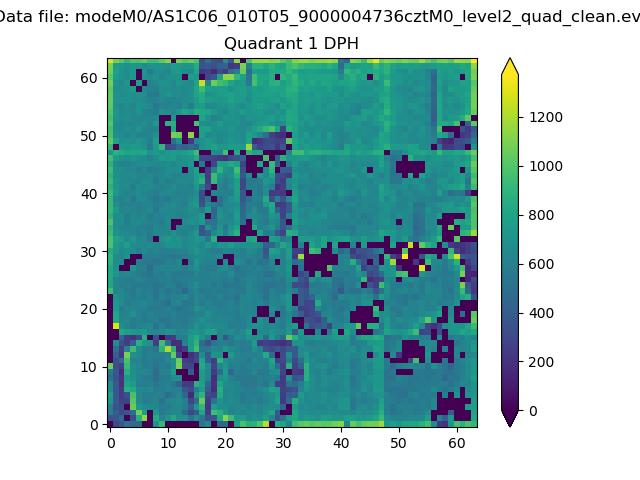
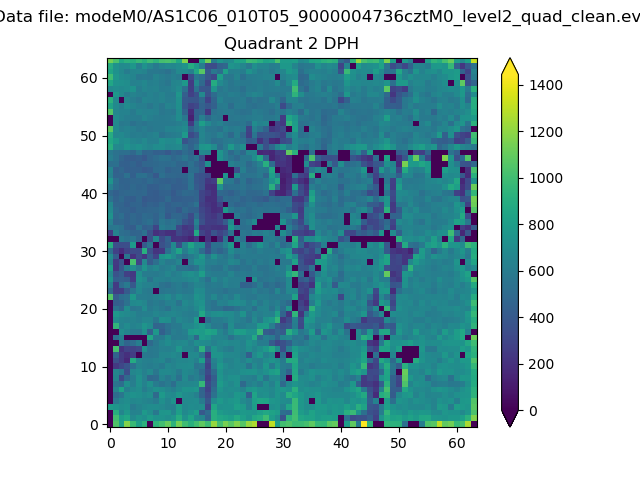
Histogram calculated using DETX and DETY for each event in the final _common_clean file
| Quadrant A | 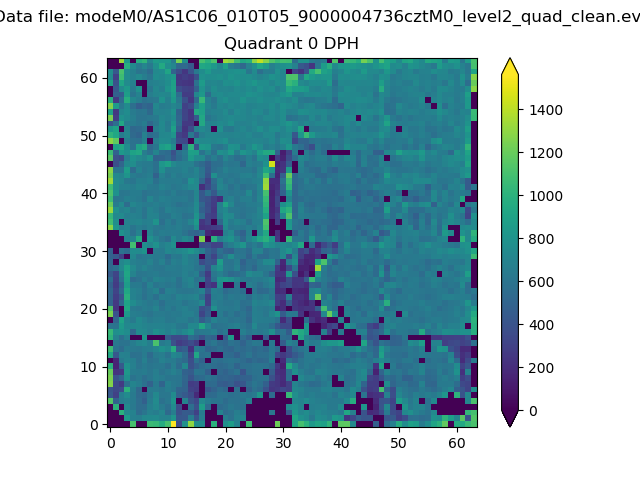 |
 |
Quadrant B |
|---|---|---|---|
| Quadrant D |  |
 |
Quadrant C |
| Plot type | Count rate plots | Images |
|---|---|---|
| Comparison with Poisson distribution Blue bars denote a histogram of data divided into 1 sec bins. Red curve is a Poisson curve with rate = median count rate of data. |
 |
 |
| Quadrant-wise count rates Data is divided into 100 sec bins |
 |
|
| Module-wise count rates for Quadrant A Data is divided into 100 sec bins |
 |
 |
| Module-wise count rates for Quadrant B Data is divided into 100 sec bins |
 |
 |
| Module-wise count rates for Quadrant C Data is divided into 100 sec bins |
 |
 |
| Module-wise count rates for Quadrant D Data is divided into 100 sec bins |
 |
 |
| Parameter | Plot |
|---|---|
| CZT HV Monitor |  |
| D_VDD |  |
| Temperature 1 | 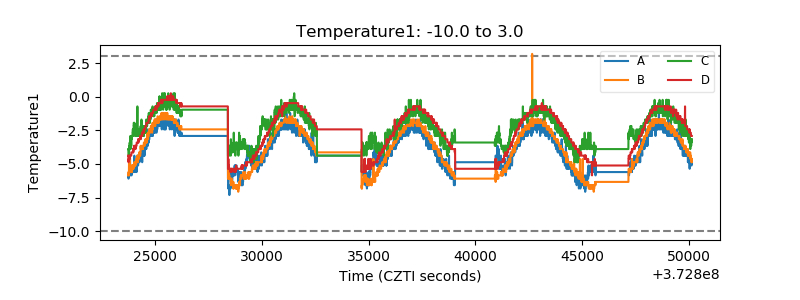 |
| Veto HV Monitor | 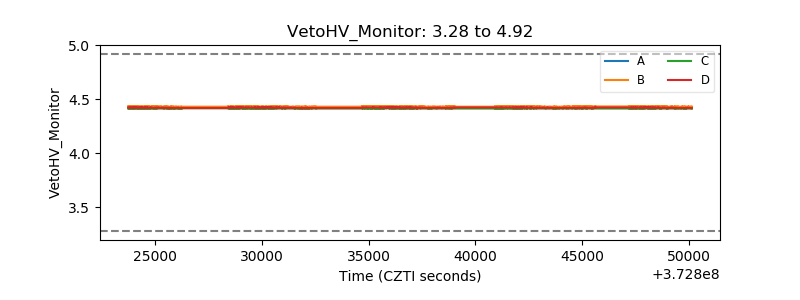 |
| Veto LLD |  |
| Alpha Counter |  |
| _CPM_Rate |  |
| CZT Counter |  |
| +2.5 Volts monitor |  |
| +5 Volts monitor |  |
| _ROLL_ROT | 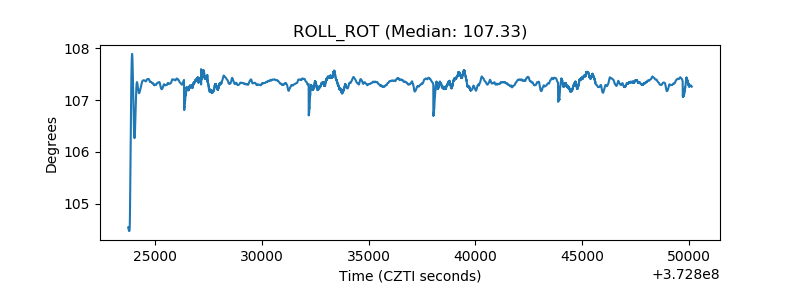 |
| _Roll_DEC |  |
| _Roll_RA | 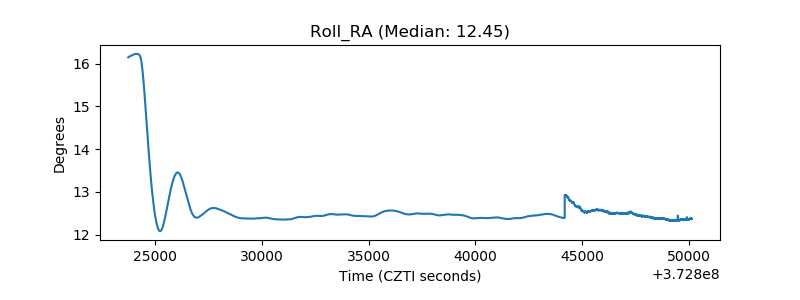 |
| Veto Counter |  |