| Param | Original file | Final file |
|---|---|---|
| Filename | modeM0/AS1A11_080T01_9000004756cztM0_level2_bc.evt | modeM0/AS1A11_080T01_9000004756cztM0_level2_quad_clean.evt |
| Size (bytes) | 1,906,536,960 | 528,765,120 |
| Size | 1.8 GB | 504.3 MB |
| Events in quadrant A | 7,466,748 | 3,596,831 |
| Events in quadrant B | 11,821,703 | 3,462,963 |
| Events in quadrant C | 8,924,011 | 3,486,319 |
| Events in quadrant D | 27,156,976 | 3,076,370 |
| Mode SS | |||
|---|---|---|---|
| Quadrant | BADHDUFLAG | Total packets | Discarded packets |
| A | 0 | 714 | 0 |
| B | 0 | 716 | 0 |
| C | 0 | 713 | 0 |
| D | 0 | 716 | 0 |
| Mode M9 | |||
|---|---|---|---|
| Quadrant | BADHDUFLAG | Total packets | Discarded packets |
| A | 0 | 133 | 0 |
| B | 0 | 136 | 0 |
| C | 0 | 135 | 0 |
| D | 0 | 137 | 0 |
| Mode M0 | |||
|---|---|---|---|
| Quadrant | BADHDUFLAG | Total packets | Discarded packets |
| A | 0 | 70692 | 0 |
| B | 0 | 89959 | 0 |
| C | 0 | 75587 | 0 |
| D | 0 | 136012 | 0 |
| Quadrant | Total seconds | Saturated seconds | Saturation percentage |
|---|---|---|---|
| A | 34852 | 29 | 0.083209% |
| B | 34805 | 1919 | 5.513576% |
| C | 34848 | 463 | 1.328627% |
| D | 34783 | 4578 | 13.161602% |
Noise dominated data is calculated using 1-second bins in cleaned event files. If a bin has >2000 counts, and if more than 50% of those come from <1% of pixels, then it is considered to be noise-dominated and hence unusable.
| Quadrant | # 1 sec bins | Bins with >0 counts | Bins with >2000 counts | High rate bins dominated by noise | Noise dominated (total time) | Noise dominated (detector-on time) | Marked lightcurve |
|---|---|---|---|---|---|---|---|
| A | 122197 | 34975 | 2 | 2 | 0.00% | 0.01% | 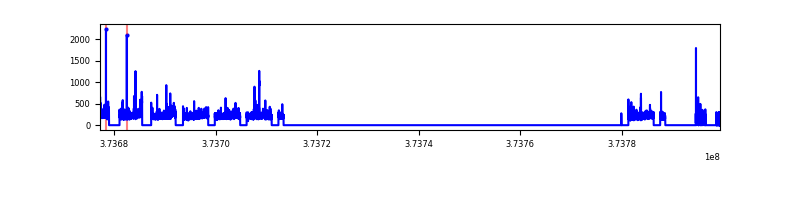 |
| B | 122199 | 34890 | 142 | 142 | 0.12% | 0.41% | 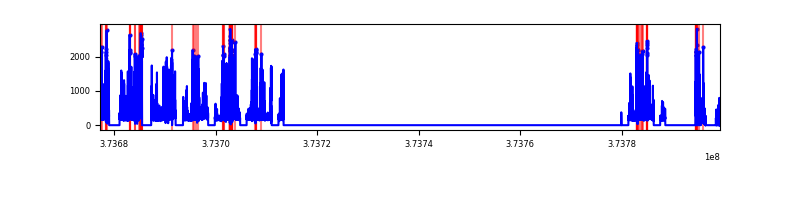 |
| C | 122199 | 34971 | 70 | 70 | 0.06% | 0.20% | 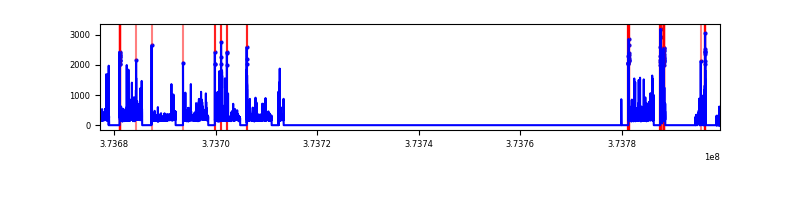 |
| D | 122198 | 34887 | 2152 | 2152 | 1.76% | 6.17% | 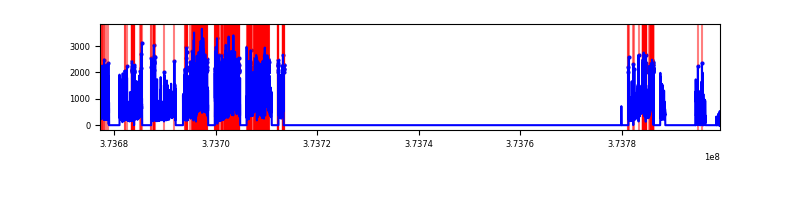 |
Top three noisy pixels from each quadrant. If the there are fewer than three noisy pixels in the level2.evt file, extra rows are filled as -1
| Pixel properties | Quadrant properties | ||||||
|---|---|---|---|---|---|---|---|
| Quadrant | DetID | PixID | Counts | Sigma | Mean | Median | Sigma |
| A | 15 | 47 | 79961 | 182.83 | 1865 | 1840 | 427.3 |
| A | 13 | 254 | 62306 | 141.51 | 1865 | 1840 | 427.3 |
| A | 13 | 6 | 49465 | 111.46 | 1865 | 1840 | 427.3 |
| B | 5 | 172 | 3751346 | 10065.42 | 1819 | 1787 | 372.5 |
| B | 0 | 219 | 268285 | 715.39 | 1819 | 1787 | 372.5 |
| B | 0 | 229 | 127111 | 336.42 | 1819 | 1787 | 372.5 |
| C | 0 | 10 | 858251 | 2028.76 | 1794 | 1790 | 422.2 |
| C | 7 | 221 | 315518 | 743.15 | 1794 | 1790 | 422.2 |
| C | 1 | 241 | 264202 | 621.59 | 1794 | 1790 | 422.2 |
| D | 8 | 195 | 5710769 | 12254.61 | 1704 | 1671 | 465.9 |
| D | 7 | 223 | 3492173 | 7492.38 | 1704 | 1671 | 465.9 |
| D | 12 | 227 | 2828633 | 6068.09 | 1704 | 1671 | 465.9 |
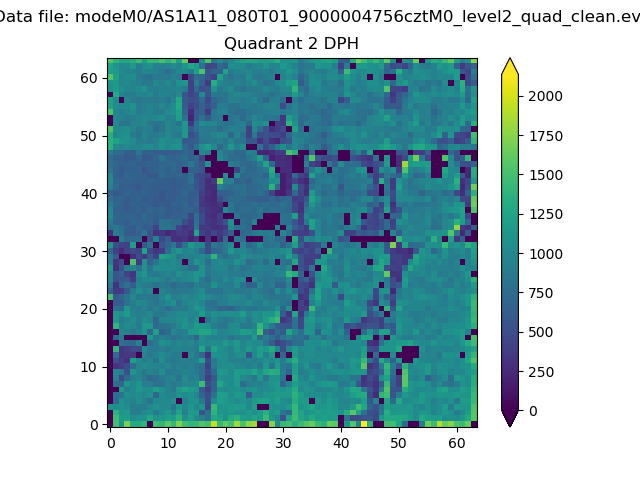
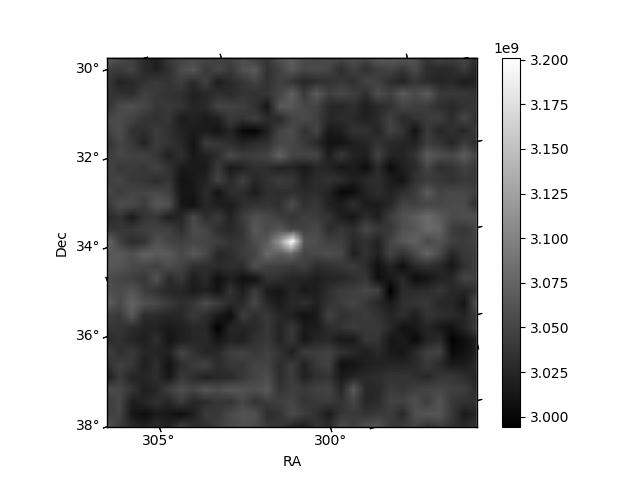
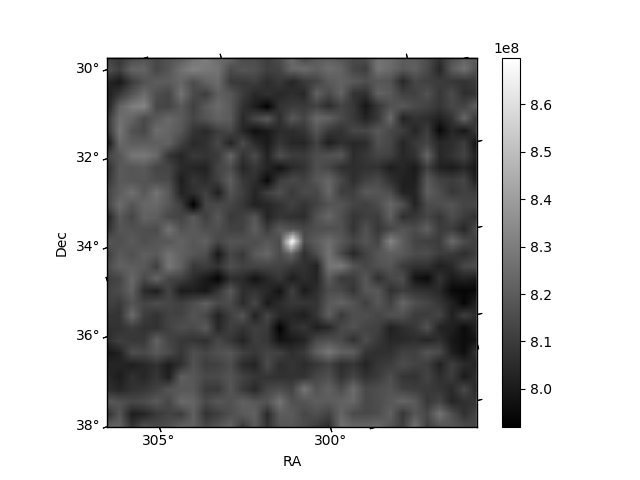
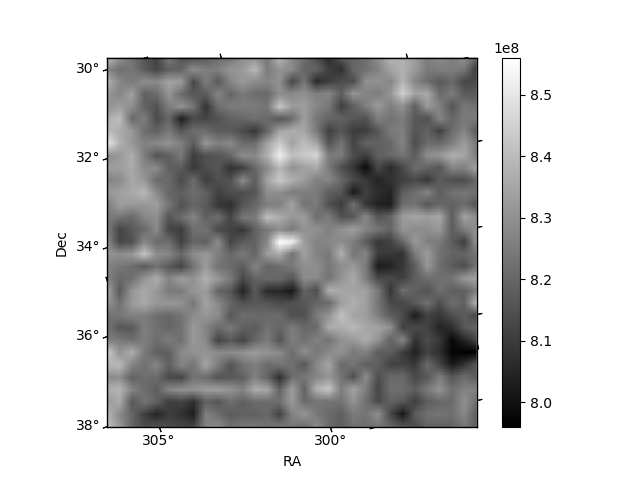
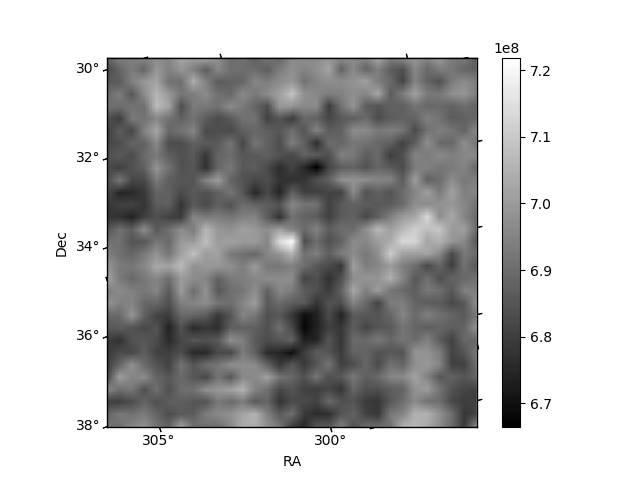
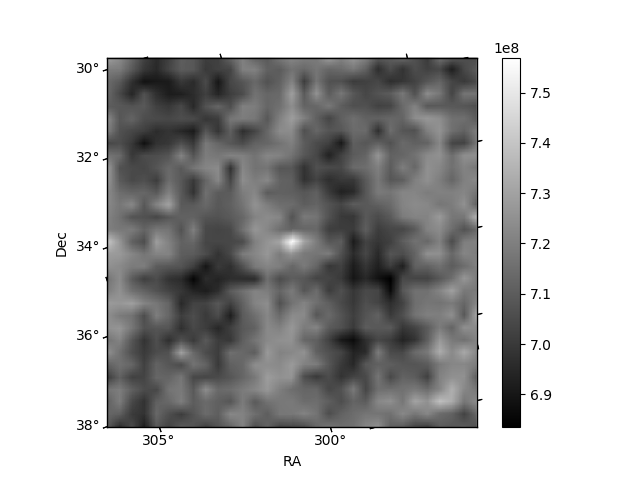
Histogram calculated using DETX and DETY for each event in the final _common_clean file
| Quadrant A | 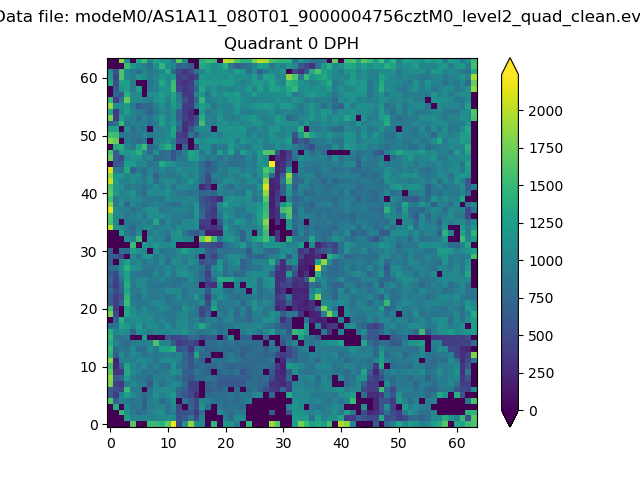 |
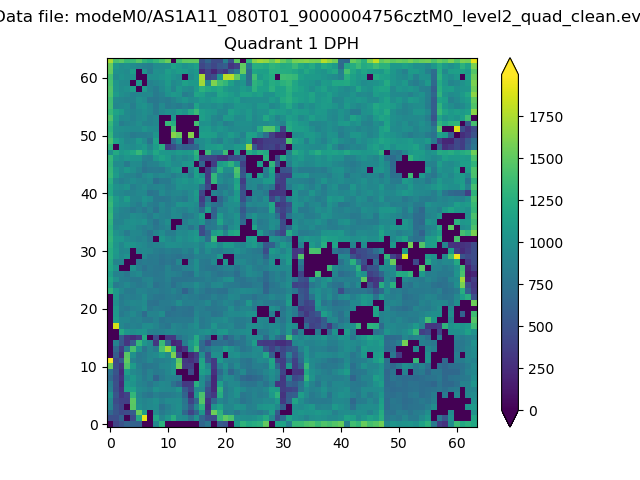 |
Quadrant B |
|---|---|---|---|
| Quadrant D | 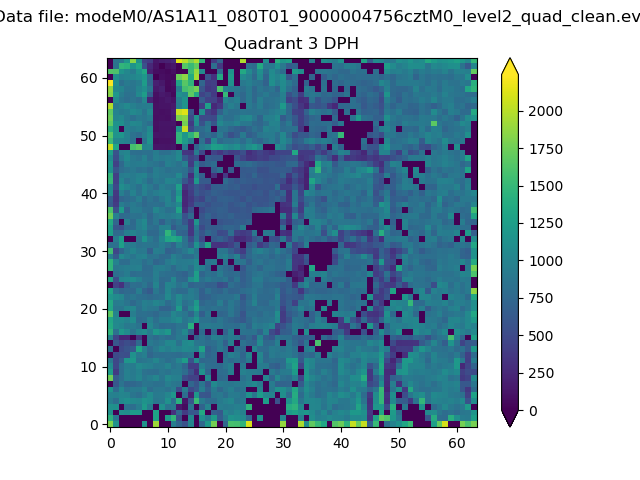 |
 |
Quadrant C |
| Plot type | Count rate plots | Images |
|---|---|---|
| Comparison with Poisson distribution Blue bars denote a histogram of data divided into 1 sec bins. Red curve is a Poisson curve with rate = median count rate of data. |
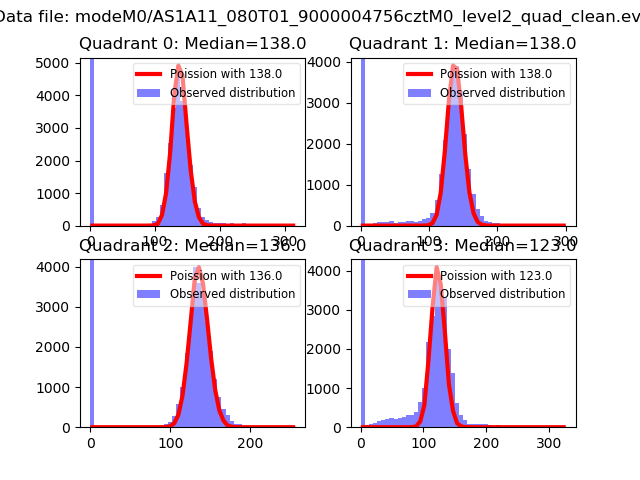 |
 |
| Quadrant-wise count rates Data is divided into 100 sec bins |
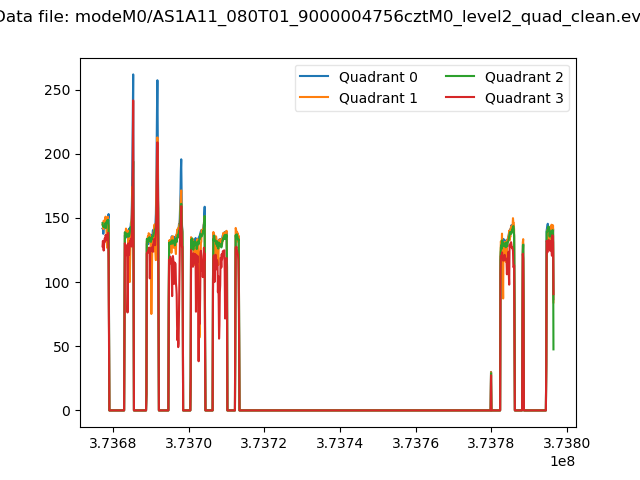 |
|
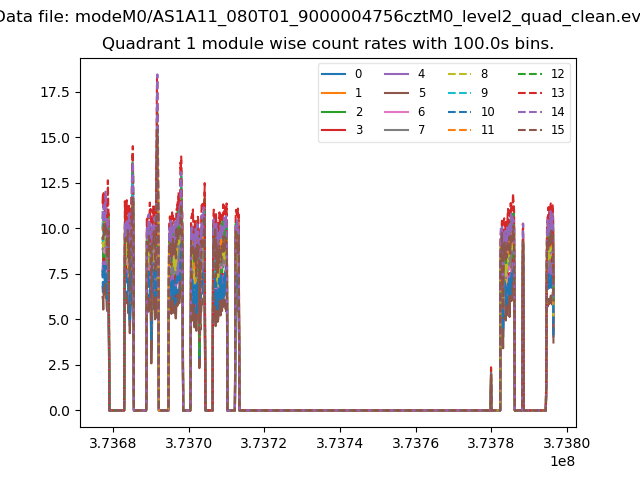
| Module-wise count rates for Quadrant A Data is divided into 100 sec bins |
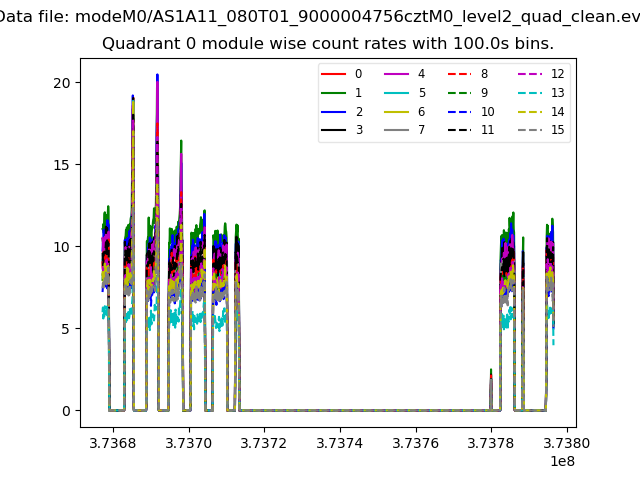 |
 |
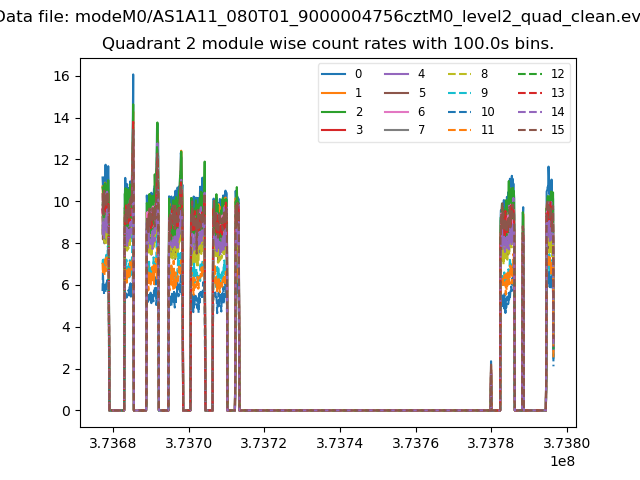
| Module-wise count rates for Quadrant B Data is divided into 100 sec bins |
 |
 |
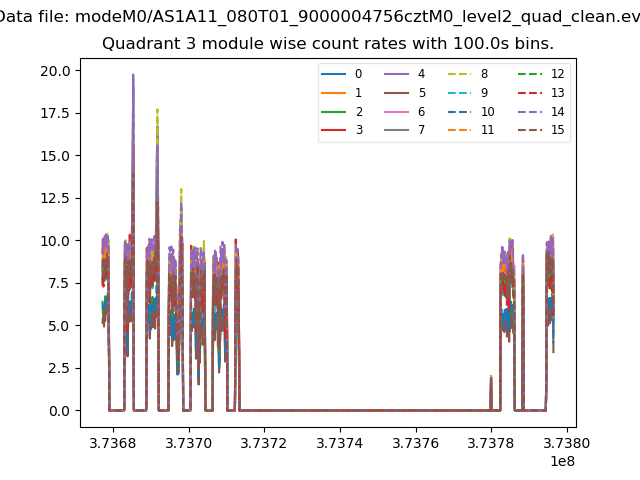
| Module-wise count rates for Quadrant C Data is divided into 100 sec bins |
 |
 |
| Module-wise count rates for Quadrant D Data is divided into 100 sec bins |
 |
 |
| Parameter | Plot |
|---|---|
| CZT HV Monitor | 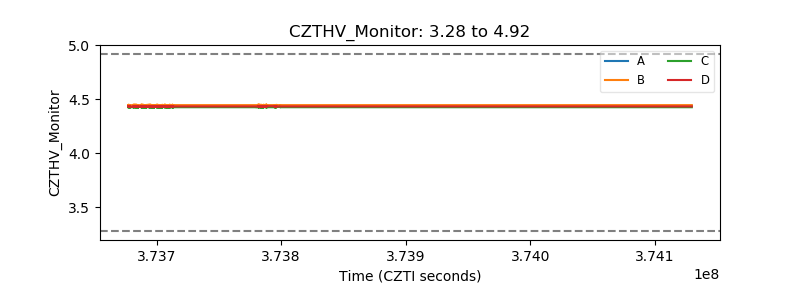 |
| D_VDD | 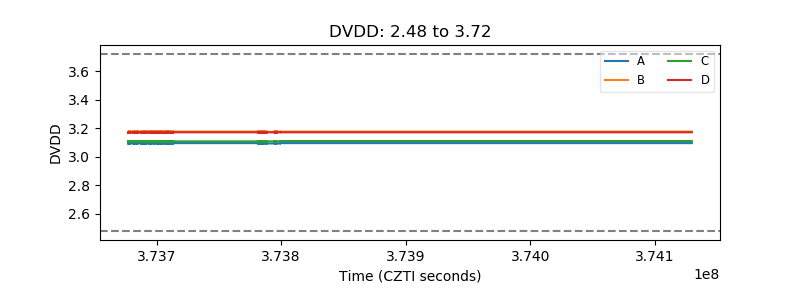 |
| Temperature 1 | 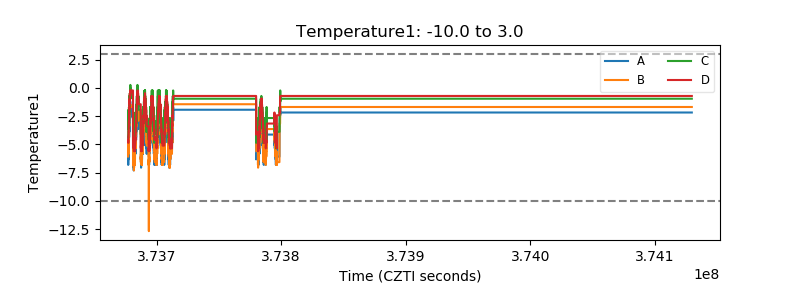 |
| Veto HV Monitor | 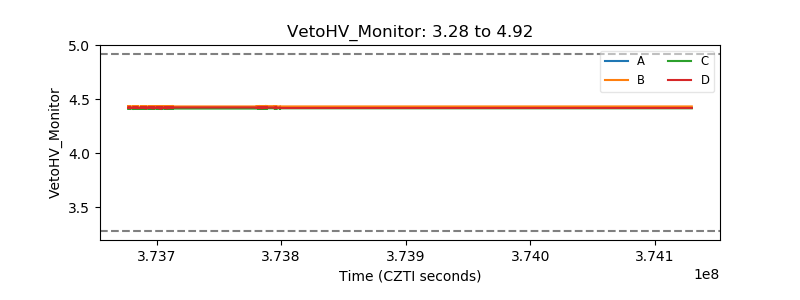 |
| Veto LLD | 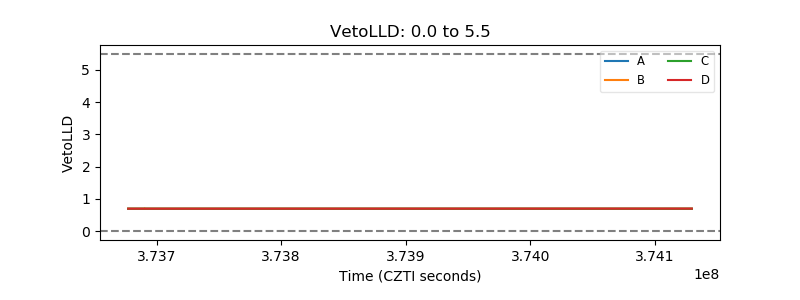 |
| Alpha Counter | 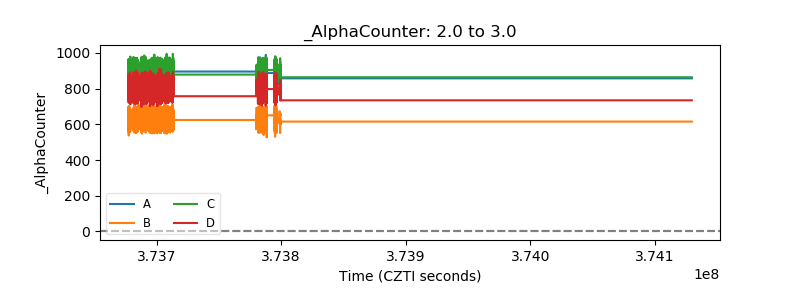 |
| _CPM_Rate | 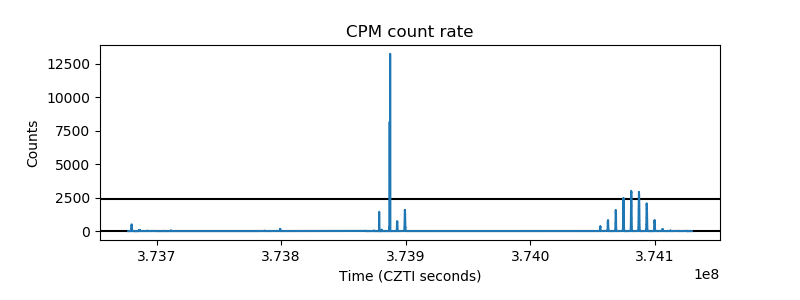 |
| CZT Counter | 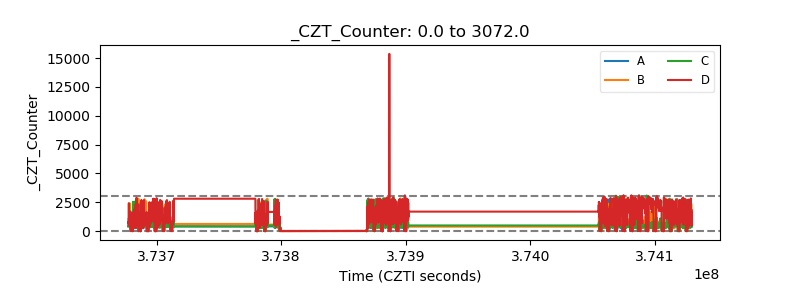 |
| +2.5 Volts monitor | 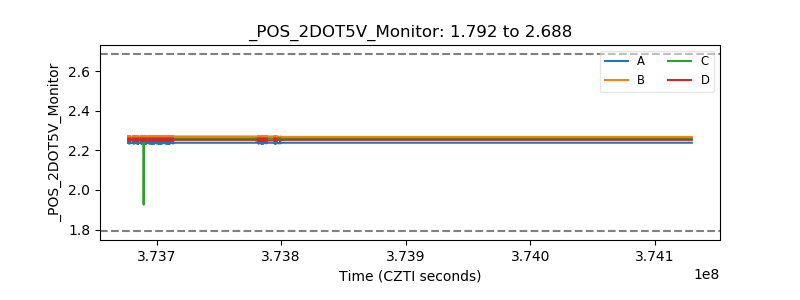 |
| +5 Volts monitor | 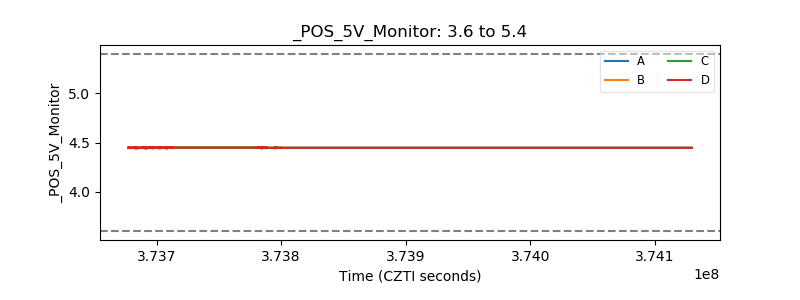 |
| _ROLL_ROT | 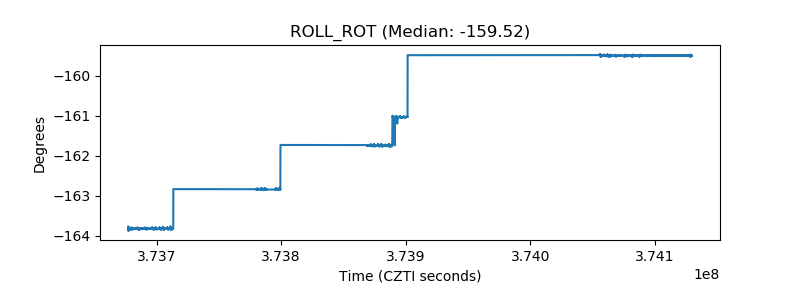 |
| _Roll_DEC | 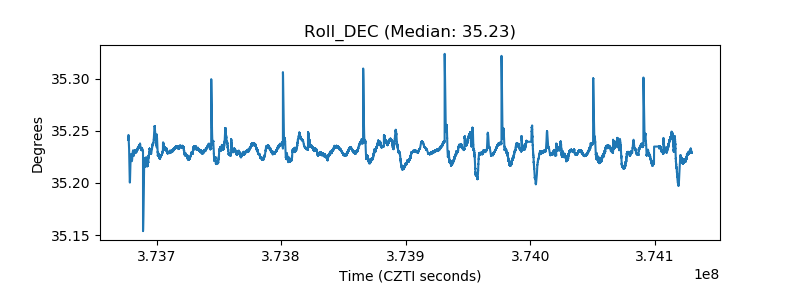 |
| _Roll_RA | 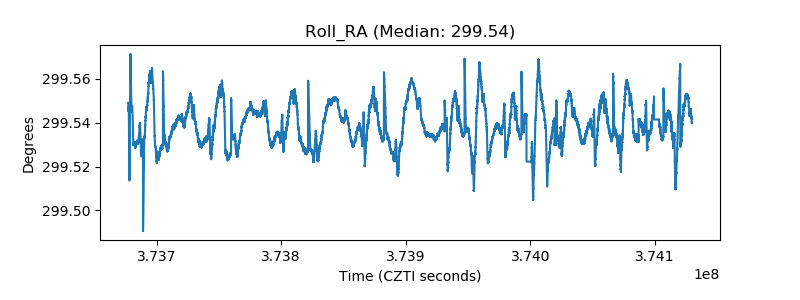 |
| Veto Counter |  |