| Param | Original file | Final file |
|---|---|---|
| Filename | modeM0/AS1A11_046T06_9000004764cztM0_level2_bc.evt | modeM0/AS1A11_046T06_9000004764cztM0_level2_quad_clean.evt |
| Size (bytes) | 1,232,830,080 | 318,110,400 |
| Size | 1.1 GB | 303.4 MB |
| Events in quadrant A | 4,819,519 | 2,153,018 |
| Events in quadrant B | 7,252,842 | 2,110,866 |
| Events in quadrant C | 6,450,586 | 2,049,589 |
| Events in quadrant D | 17,351,112 | 1,843,899 |
| Mode M0 | |||
|---|---|---|---|
| Quadrant | BADHDUFLAG | Total packets | Discarded packets |
| A | 0 | 44048 | 0 |
| B | 0 | 55062 | 0 |
| C | 0 | 49760 | 0 |
| D | 0 | 87980 | 0 |
| Mode M9 | |||
|---|---|---|---|
| Quadrant | BADHDUFLAG | Total packets | Discarded packets |
| A | 0 | 119 | 0 |
| B | 0 | 119 | 0 |
| C | 0 | 119 | 0 |
| D | 0 | 119 | 0 |
| Mode SS | |||
|---|---|---|---|
| Quadrant | BADHDUFLAG | Total packets | Discarded packets |
| A | 0 | 440 | 0 |
| B | 0 | 440 | 0 |
| C | 0 | 440 | 0 |
| D | 0 | 440 | 0 |
| Quadrant | Total seconds | Saturated seconds | Saturation percentage |
|---|---|---|---|
| A | 21448 | 22 | 0.102574% |
| B | 21448 | 1029 | 4.797650% |
| C | 21448 | 256 | 1.193584% |
| D | 21448 | 3260 | 15.199552% |
Noise dominated data is calculated using 1-second bins in cleaned event files. If a bin has >2000 counts, and if more than 50% of those come from <1% of pixels, then it is considered to be noise-dominated and hence unusable.
| Quadrant | # 1 sec bins | Bins with >0 counts | Bins with >2000 counts | High rate bins dominated by noise | Noise dominated (total time) | Noise dominated (detector-on time) | Marked lightcurve |
|---|---|---|---|---|---|---|---|
| A | 31582 | 21447 | 1 | 1 | 0.00% | 0.00% |  |
| B | 31582 | 21443 | 38 | 38 | 0.12% | 0.18% |  |
| C | 31582 | 21448 | 24 | 24 | 0.08% | 0.11% |  |
| D | 31582 | 21446 | 1524 | 1524 | 4.83% | 7.11% | 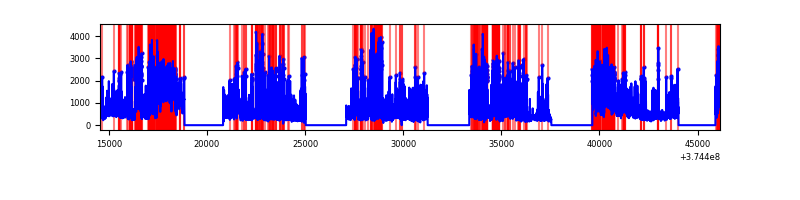 |
Top three noisy pixels from each quadrant. If the there are fewer than three noisy pixels in the level2.evt file, extra rows are filled as -1
| Pixel properties | Quadrant properties | ||||||
|---|---|---|---|---|---|---|---|
| Quadrant | DetID | PixID | Counts | Sigma | Mean | Median | Sigma |
| A | 13 | 254 | 39371 | 141.42 | 1232 | 1216 | 269.8 |
| A | 13 | 6 | 29255 | 103.93 | 1232 | 1216 | 269.8 |
| A | 7 | 16 | 12911 | 43.35 | 1232 | 1216 | 269.8 |
| B | 5 | 172 | 1774431 | 7394.97 | 1214 | 1193 | 239.8 |
| B | 5 | 200 | 183795 | 761.51 | 1214 | 1193 | 239.8 |
| B | 0 | 189 | 137456 | 568.26 | 1214 | 1193 | 239.8 |
| C | 7 | 221 | 1013926 | 3876.65 | 1166 | 1161 | 261.2 |
| C | 0 | 10 | 592881 | 2264.98 | 1166 | 1161 | 261.2 |
| C | 1 | 241 | 48937 | 182.88 | 1166 | 1161 | 261.2 |
| D | 7 | 223 | 5938424 | 21548.12 | 1115 | 1089 | 275.5 |
| D | 8 | 195 | 2274687 | 8251.47 | 1115 | 1089 | 275.5 |
| D | 2 | 249 | 1248832 | 4528.38 | 1115 | 1089 | 275.5 |
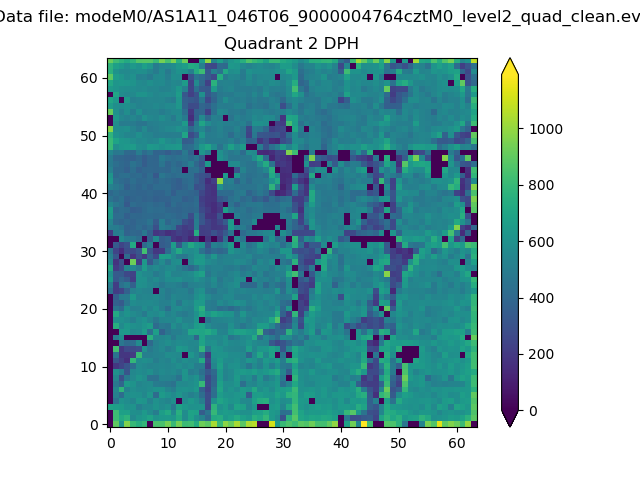
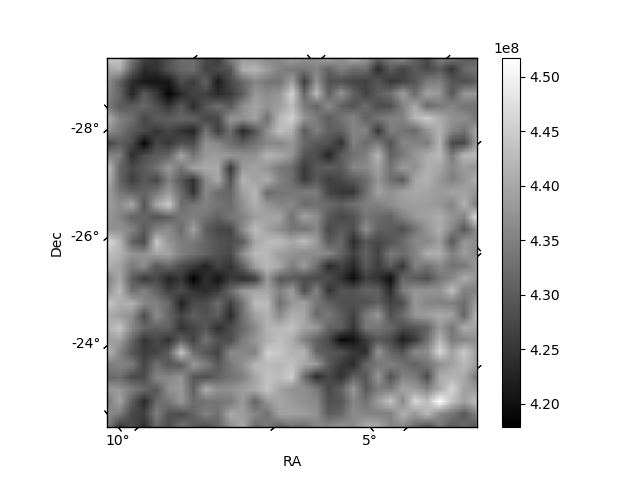
Histogram calculated using DETX and DETY for each event in the final _common_clean file
| Quadrant A | 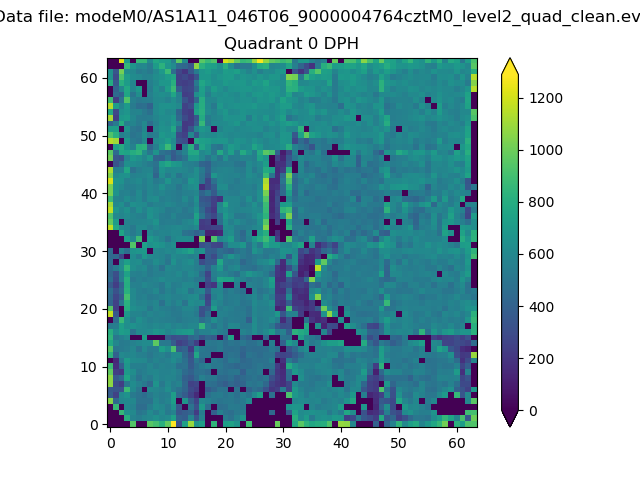 |
 |
Quadrant B |
|---|---|---|---|
| Quadrant D | 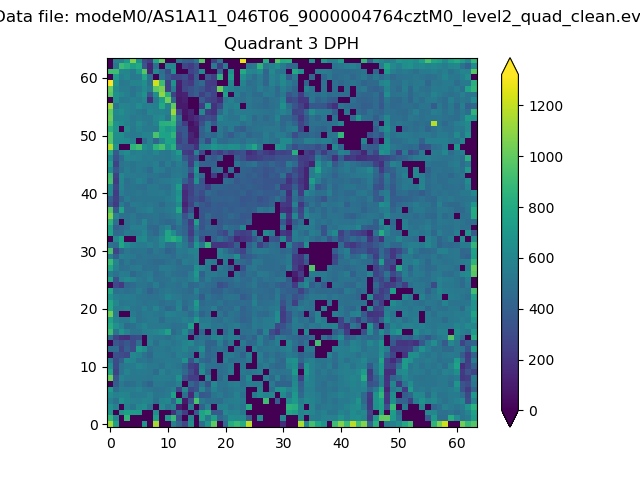 |
 |
Quadrant C |
| Plot type | Count rate plots | Images |
|---|---|---|
| Comparison with Poisson distribution Blue bars denote a histogram of data divided into 1 sec bins. Red curve is a Poisson curve with rate = median count rate of data. |
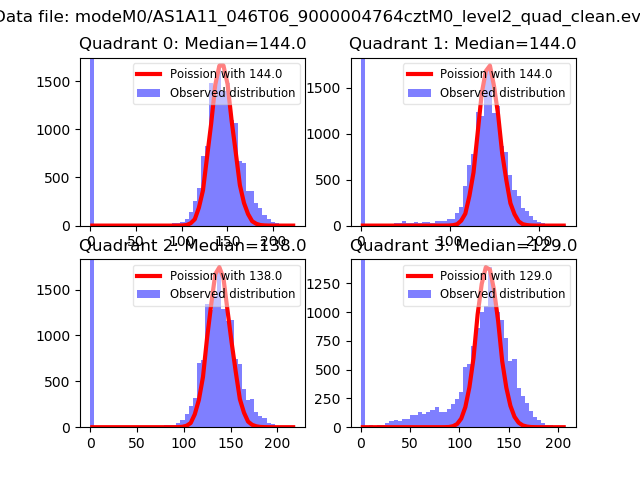 |
 |
| Quadrant-wise count rates Data is divided into 100 sec bins |
 |
|
| Module-wise count rates for Quadrant A Data is divided into 100 sec bins |
 |
 |
| Module-wise count rates for Quadrant B Data is divided into 100 sec bins |
 |
 |
| Module-wise count rates for Quadrant C Data is divided into 100 sec bins |
 |
 |
| Module-wise count rates for Quadrant D Data is divided into 100 sec bins |
 |
 |
| Parameter | Plot |
|---|---|
| CZT HV Monitor | 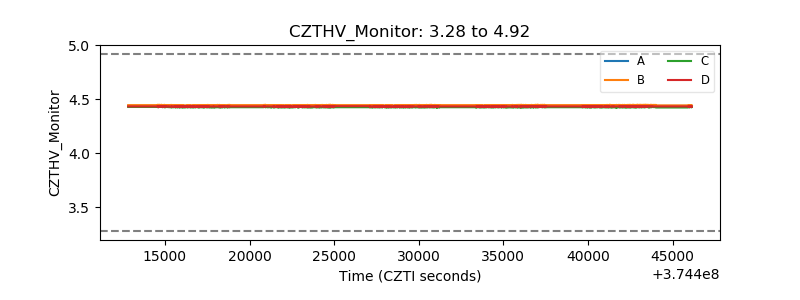 |
| D_VDD | 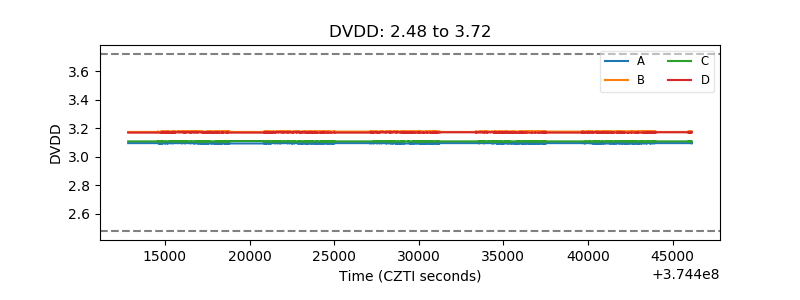 |
| Temperature 1 |  |
| Veto HV Monitor | 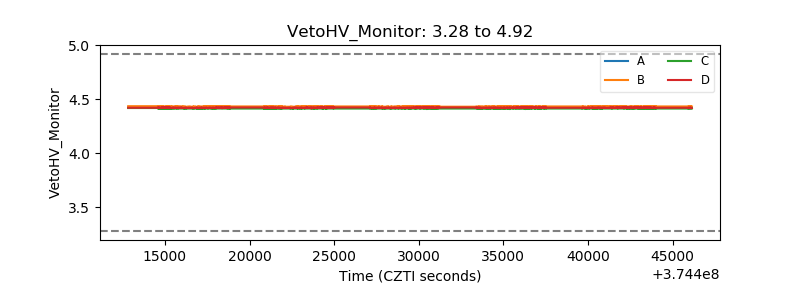 |
| Veto LLD |  |
| Alpha Counter |  |
| _CPM_Rate |  |
| CZT Counter |  |
| +2.5 Volts monitor | 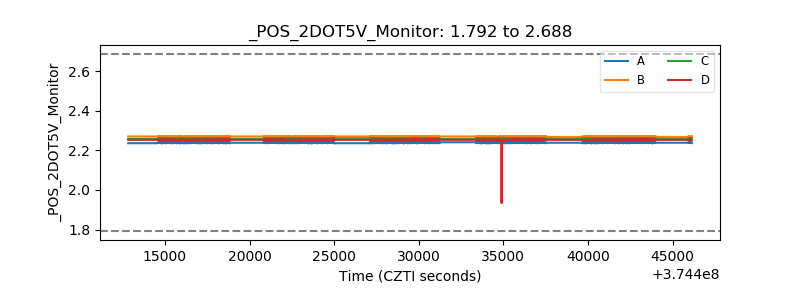 |
| +5 Volts monitor |  |
| _ROLL_ROT | 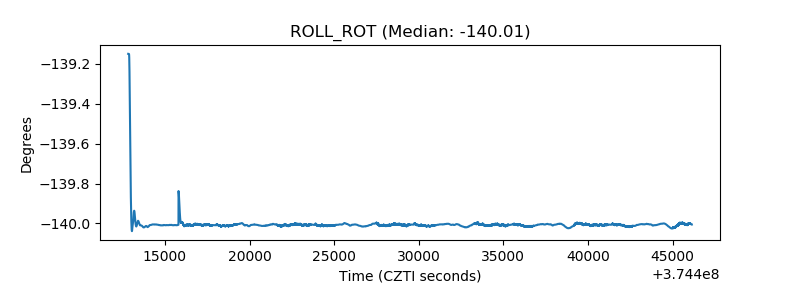 |
| _Roll_DEC |  |
| _Roll_RA | 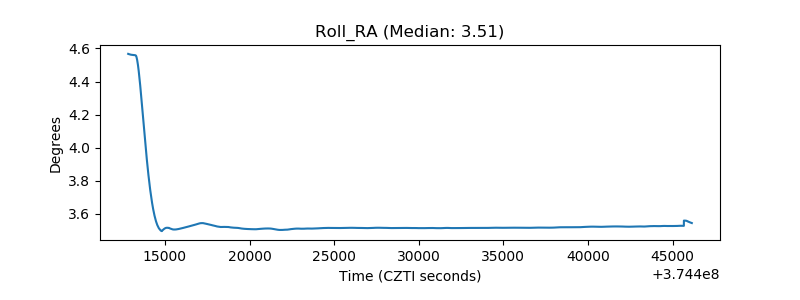 |
| Veto Counter |  |