| Param | Original file | Final file |
|---|---|---|
| Filename | modeM0/AS1A11_034T07_9000004860cztM0_level2_bc.evt | modeM0/AS1A11_034T07_9000004860cztM0_level2_quad_clean.evt |
| Size (bytes) | 561,012,480 | 144,987,840 |
| Size | 535.0 MB | 138.3 MB |
| Events in quadrant A | 2,350,706 | 82,055 |
| Events in quadrant B | 3,661,605 | 1,238,101 |
| Events in quadrant C | 4,172,108 | 1,208,646 |
| Events in quadrant D | 6,089,498 | 1,143,279 |
| Mode SS | |||
|---|---|---|---|
| Quadrant | BADHDUFLAG | Total packets | Discarded packets |
| A | 0 | 210 | 0 |
| B | 0 | 210 | 0 |
| C | 0 | 210 | 0 |
| D | 0 | 210 | 0 |
| Mode M0 | |||
|---|---|---|---|
| Quadrant | BADHDUFLAG | Total packets | Discarded packets |
| A | 0 | 51442 | 0 |
| B | 0 | 26473 | 0 |
| C | 0 | 27394 | 0 |
| D | 0 | 34987 | 0 |
| Mode M9 | |||
|---|---|---|---|
| Quadrant | BADHDUFLAG | Total packets | Discarded packets |
| A | 0 | 57 | 0 |
| B | 0 | 57 | 0 |
| C | 0 | 57 | 0 |
| D | 0 | 57 | 0 |
| Quadrant | Total seconds | Saturated seconds | Saturation percentage |
|---|---|---|---|
| A | 10315 | 10313 | 99.980611% |
| B | 10315 | 283 | 2.743577% |
| C | 10315 | 380 | 3.683955% |
| D | 10315 | 596 | 5.777993% |
Noise dominated data is calculated using 1-second bins in cleaned event files. If a bin has >2000 counts, and if more than 50% of those come from <1% of pixels, then it is considered to be noise-dominated and hence unusable.
| Quadrant | # 1 sec bins | Bins with >0 counts | Bins with >2000 counts | High rate bins dominated by noise | Noise dominated (total time) | Noise dominated (detector-on time) | Marked lightcurve |
|---|---|---|---|---|---|---|---|
| A | 14377 | 6680 | 1 | 1 | 0.01% | 0.01% | 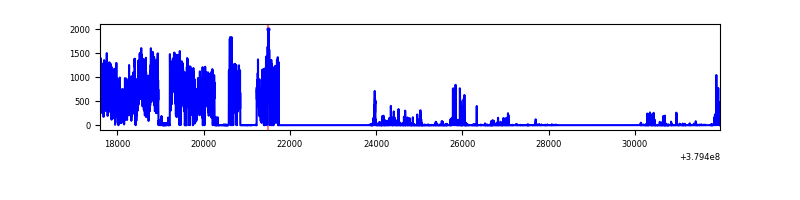 |
| B | 14378 | 10314 | 24 | 24 | 0.17% | 0.23% |  |
| C | 14378 | 10314 | 57 | 57 | 0.40% | 0.55% | 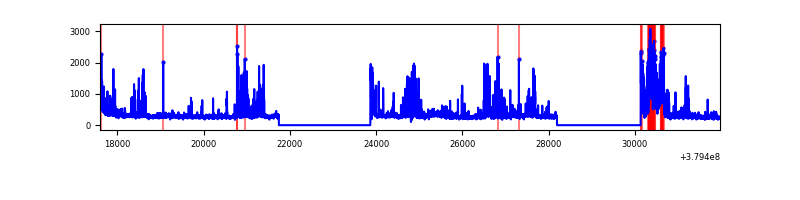 |
| D | 14378 | 10314 | 82 | 82 | 0.57% | 0.80% | 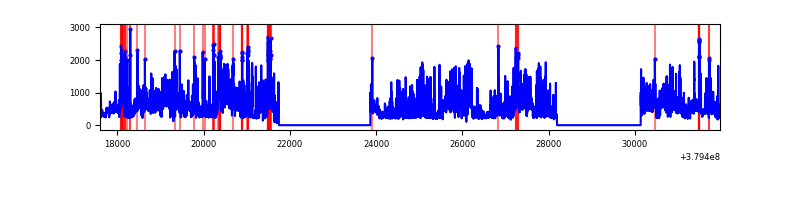 |
Top three noisy pixels from each quadrant. If the there are fewer than three noisy pixels in the level2.evt file, extra rows are filled as -1
| Pixel properties | Quadrant properties | ||||||
|---|---|---|---|---|---|---|---|
| Quadrant | DetID | PixID | Counts | Sigma | Mean | Median | Sigma |
| A | 15 | 169 | 2168999 | 168162.14 | 45 | 45 | 12.9 |
| A | 13 | 6 | 3028 | 231.28 | 45 | 45 | 12.9 |
| A | 10 | 83 | 2082 | 157.93 | 45 | 45 | 12.9 |
| B | 5 | 172 | 796554 | 7063.49 | 574 | 564 | 112.7 |
| B | 0 | 190 | 205992 | 1822.94 | 574 | 564 | 112.7 |
| B | 0 | 219 | 82205 | 724.47 | 574 | 564 | 112.7 |
| C | 4 | 254 | 984528 | 7784.19 | 554 | 551 | 126.4 |
| C | 15 | 214 | 428020 | 3381.68 | 554 | 551 | 126.4 |
| C | 0 | 10 | 312535 | 2468.09 | 554 | 551 | 126.4 |
| D | 8 | 195 | 1638322 | 12288.37 | 555 | 539 | 133.3 |
| D | 13 | 249 | 420796 | 3153.21 | 555 | 539 | 133.3 |
| D | 7 | 223 | 367897 | 2756.31 | 555 | 539 | 133.3 |
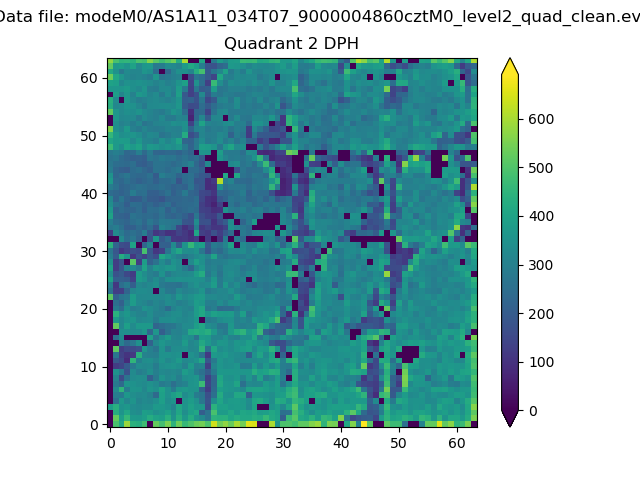
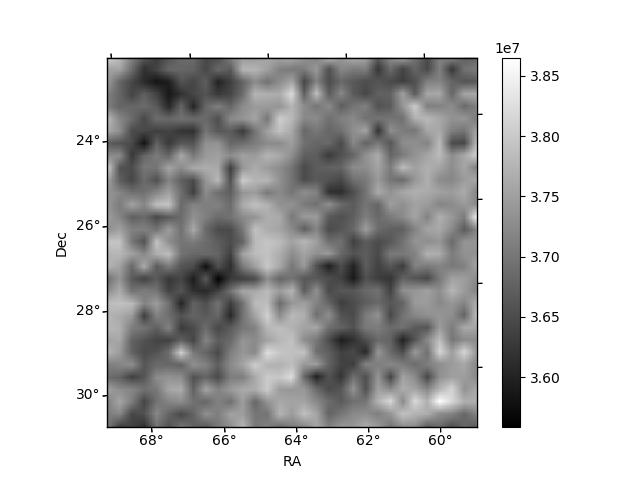
Histogram calculated using DETX and DETY for each event in the final _common_clean file
| Quadrant A | 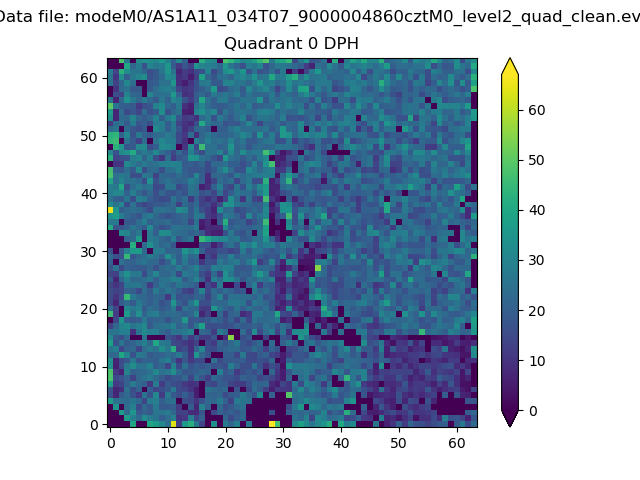 |
 |
Quadrant B |
|---|---|---|---|
| Quadrant D | 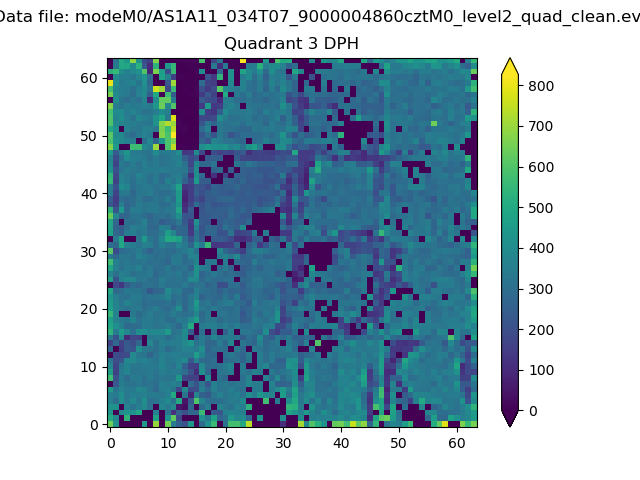 |
 |
Quadrant C |
| Plot type | Count rate plots | Images |
|---|---|---|
| Comparison with Poisson distribution Blue bars denote a histogram of data divided into 1 sec bins. Red curve is a Poisson curve with rate = median count rate of data. |
 |
 |
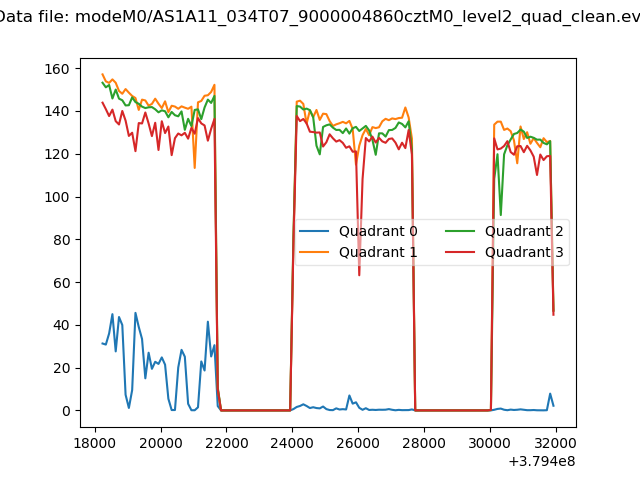
| Quadrant-wise count rates Data is divided into 100 sec bins |
 |
|
| Module-wise count rates for Quadrant A Data is divided into 100 sec bins |
 |
 |
| Module-wise count rates for Quadrant B Data is divided into 100 sec bins |
 |
 |
| Module-wise count rates for Quadrant C Data is divided into 100 sec bins |
 |
 |
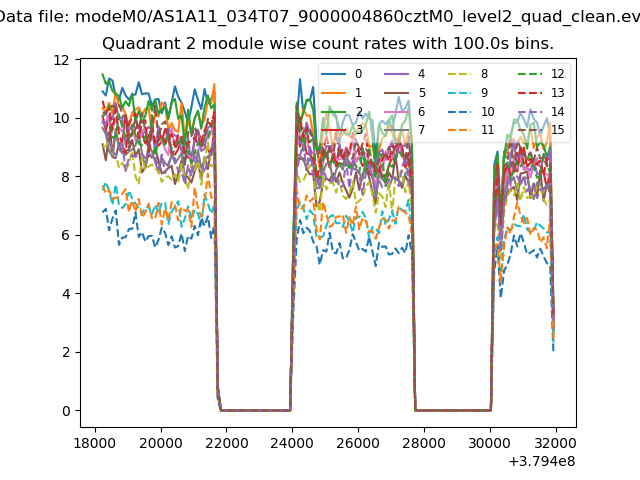
| Module-wise count rates for Quadrant D Data is divided into 100 sec bins |
 |
 |
| Parameter | Plot |
|---|---|
| CZT HV Monitor |  |
| D_VDD | 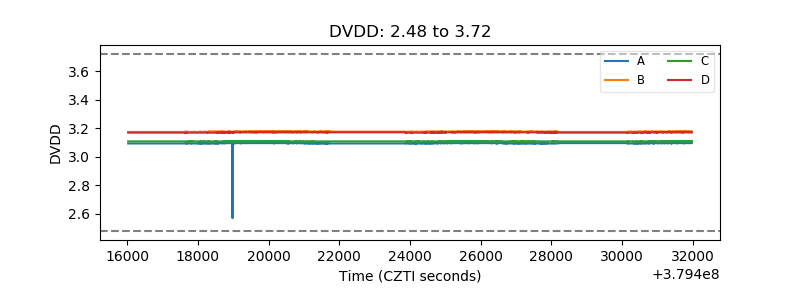 |
| Temperature 1 |  |
| Veto HV Monitor |  |
| Veto LLD |  |
| Alpha Counter |  |
| _CPM_Rate | 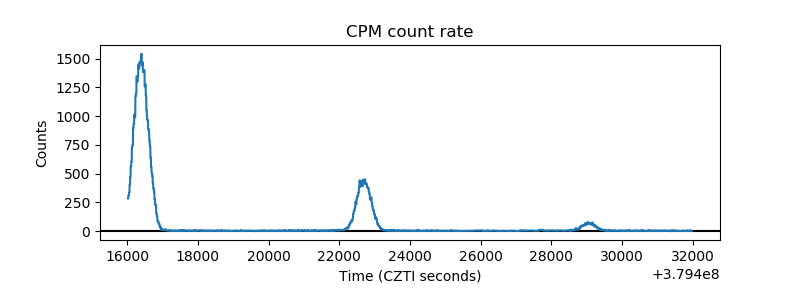 |
| CZT Counter |  |
| +2.5 Volts monitor |  |
| +5 Volts monitor |  |
| _ROLL_ROT | 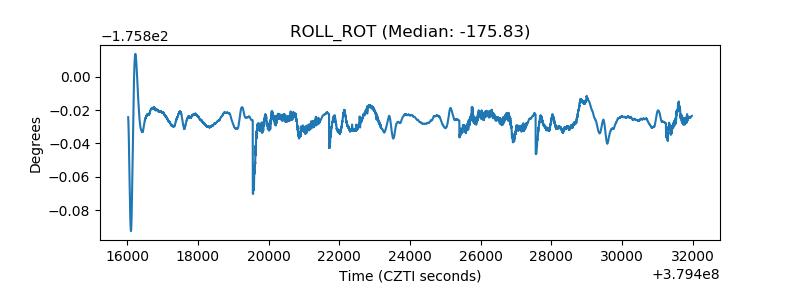 |
| _Roll_DEC | 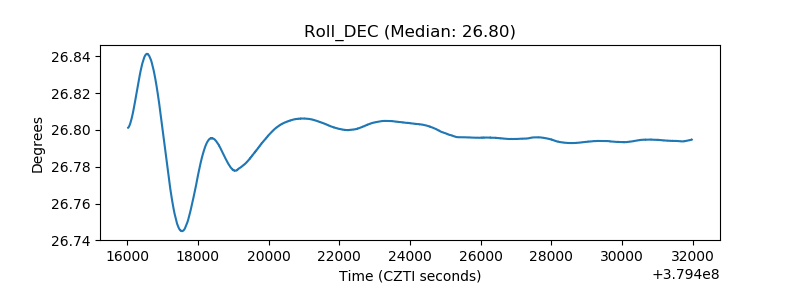 |
| _Roll_RA |  |
| Veto Counter |  |