| Param | Original file | Final file |
|---|---|---|
| Filename | modeM0/AS1A11_047T01_9000004904cztM0_level2.fits | modeM0/AS1A11_047T01_9000004904cztM0_level2_quad_clean.evt |
| Size (bytes) | 65,848,320 | 33,802,560 |
| Size | 62.8 MB | 32.2 MB |
| Events in quadrant A | 422,172 | 154,623 |
| Events in quadrant B | 395,336 | 153,239 |
| Events in quadrant C | 405,480 | 147,561 |
| Events in quadrant D | 305,796 | 102,010 |
| Mode SS | |||
|---|---|---|---|
| Quadrant | BADHDUFLAG | Total packets | Discarded packets |
| A | 0 | 134 | 0 |
| B | 0 | 134 | 0 |
| C | 0 | 134 | 0 |
| D | 0 | 134 | 0 |
| Mode M0 | |||
|---|---|---|---|
| Quadrant | BADHDUFLAG | Total packets | Discarded packets |
| A | 0 | 13843 | 0 |
| B | 0 | 15545 | 0 |
| C | 0 | 15164 | 0 |
| D | 0 | 27873 | 0 |
| Mode M9 | |||
|---|---|---|---|
| Quadrant | BADHDUFLAG | Total packets | Discarded packets |
| A | 0 | 36 | 0 |
| B | 0 | 36 | 0 |
| C | 0 | 36 | 0 |
| D | 0 | 36 | 0 |
| Quadrant | Total seconds | Saturated seconds | Saturation percentage |
|---|---|---|---|
| A | 6682 | 9 | 0.134690% |
| B | 6682 | 140 | 2.095181% |
| C | 6682 | 115 | 1.721042% |
| D | 6682 | 1289 | 19.290632% |
Noise dominated data is calculated using 1-second bins in cleaned event files. If a bin has >2000 counts, and if more than 50% of those come from <1% of pixels, then it is considered to be noise-dominated and hence unusable.
| Quadrant | # 1 sec bins | Bins with >0 counts | Bins with >2000 counts | High rate bins dominated by noise | Noise dominated (total time) | Noise dominated (detector-on time) | Marked lightcurve |
|---|---|---|---|---|---|---|---|
| A | 10178 | 6682 | 0 | 0 | 0.00% | 0.00% |  |
| B | 10178 | 6682 | 0 | 0 | 0.00% | 0.00% | 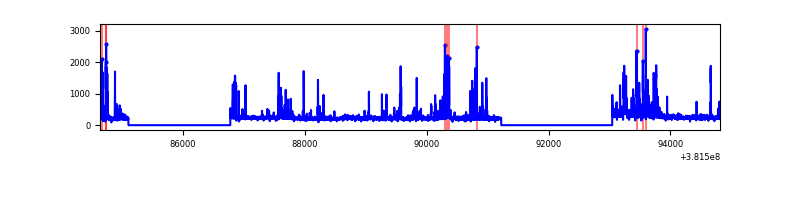 |
| C | 10178 | 6675 | 0 | 0 | 0.00% | 0.00% |  |
| D | 10176 | 6655 | 0 | 0 | 0.00% | 0.00% |  |
Top three noisy pixels from each quadrant. If the there are fewer than three noisy pixels in the level2.evt file, extra rows are filled as -1
| Pixel properties | Quadrant properties | ||||||
|---|---|---|---|---|---|---|---|
| Quadrant | DetID | PixID | Counts | Sigma | Mean | Median | Sigma |
| A | 7 | 110 | 351 | 8.54 | 110 | 105 | 28.8 |
| A | 9 | 19 | 334 | 7.95 | 110 | 105 | 28.8 |
| A | 15 | 236 | 300 | 6.77 | 110 | 105 | 28.8 |
| B | 2 | 9 | 309 | 9.17 | 104 | 100 | 22.8 |
| B | 3 | 80 | 294 | 8.51 | 104 | 100 | 22.8 |
| B | 2 | 8 | 269 | 7.41 | 104 | 100 | 22.8 |
| C | 3 | 158 | 296 | 6.68 | 107 | 102 | 29.0 |
| C | 1 | 65 | 280 | 6.13 | 107 | 102 | 29.0 |
| C | 3 | 235 | 277 | 6.03 | 107 | 102 | 29.0 |
| D | 4 | 160 | 247 | 6.84 | 87 | 80 | 24.4 |
| D | 10 | 189 | 238 | 6.47 | 87 | 80 | 24.4 |
| D | 1 | 3 | 221 | 5.77 | 87 | 80 | 24.4 |
Histogram calculated using DETX and DETY for each event in the final _common_clean file
| Quadrant A | 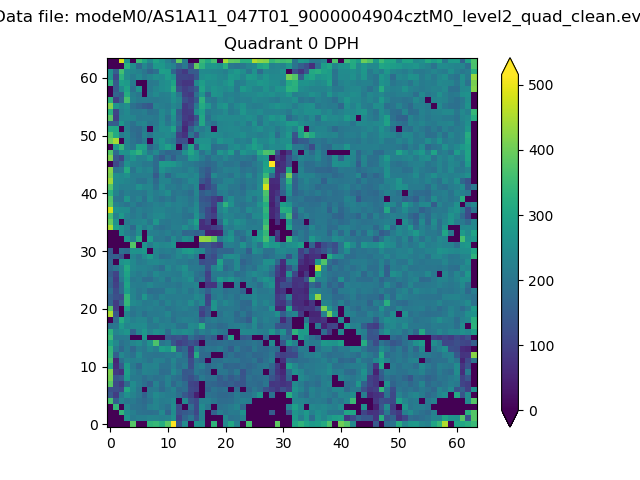 |
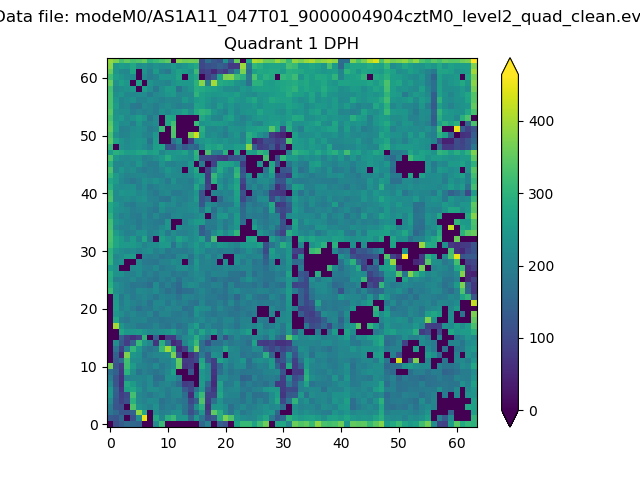 |
Quadrant B |
|---|---|---|---|
| Quadrant D |  |
 |
Quadrant C |
| Plot type | Count rate plots | Images |
|---|---|---|
| Comparison with Poisson distribution Blue bars denote a histogram of data divided into 1 sec bins. Red curve is a Poisson curve with rate = median count rate of data. |
 |
 |
| Quadrant-wise count rates Data is divided into 100 sec bins |
 |
|
| Module-wise count rates for Quadrant A Data is divided into 100 sec bins |
 |
 |
| Module-wise count rates for Quadrant B Data is divided into 100 sec bins |
 |
 |
| Module-wise count rates for Quadrant C Data is divided into 100 sec bins |
 |
 |
| Module-wise count rates for Quadrant D Data is divided into 100 sec bins |
 |
 |
| Parameter | Plot |
|---|---|
| CZT HV Monitor |  |
| D_VDD | 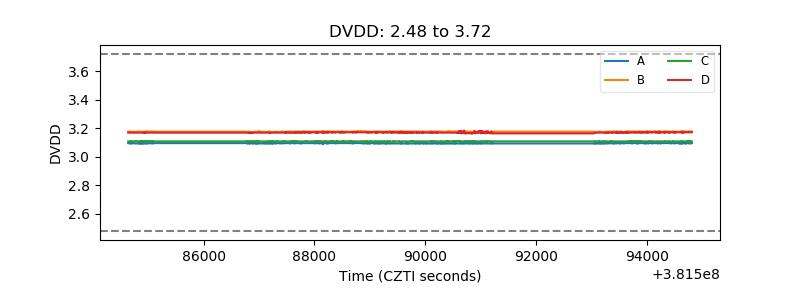 |
| Temperature 1 |  |
| Veto HV Monitor |  |
| Veto LLD |  |
| Alpha Counter |  |
| _CPM_Rate |  |
| CZT Counter |  |
| +2.5 Volts monitor | 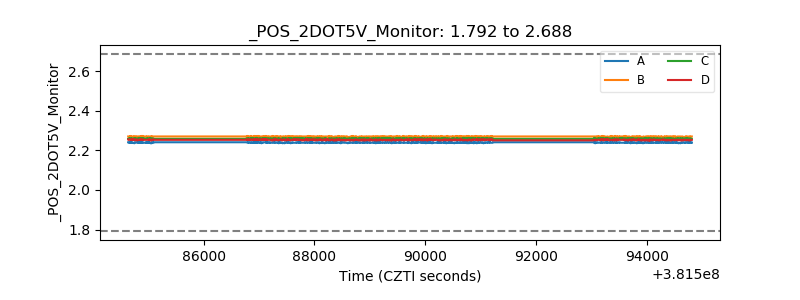 |
| +5 Volts monitor |  |
| _ROLL_ROT |  |
| _Roll_DEC |  |
| _Roll_RA |  |
| Veto Counter |  |