| Param | Original file | Final file |
|---|---|---|
| Filename | modeM0/AS1A05_108T02_9000004914cztM0_level2.fits | modeM0/AS1A05_108T02_9000004914cztM0_level2_quad_clean.evt |
| Size (bytes) | 650,200,320 | 604,969,920 |
| Size | 620.1 MB | 576.9 MB |
| Events in quadrant A | 4,088,234 | 3,662,016 |
| Events in quadrant B | 3,824,854 | 3,587,512 |
| Events in quadrant C | 3,946,134 | 3,461,088 |
| Events in quadrant D | 3,281,926 | 3,061,299 |
| Mode SS | |||
|---|---|---|---|
| Quadrant | BADHDUFLAG | Total packets | Discarded packets |
| A | 0 | 1354 | 0 |
| B | 0 | 1354 | 0 |
| C | 0 | 1354 | 0 |
| D | 0 | 1354 | 0 |
| Mode M9 | |||
|---|---|---|---|
| Quadrant | BADHDUFLAG | Total packets | Discarded packets |
| A | 0 | 264 | 0 |
| B | 0 | 264 | 0 |
| C | 0 | 264 | 0 |
| D | 0 | 264 | 0 |
| Mode M0 | |||
|---|---|---|---|
| Quadrant | BADHDUFLAG | Total packets | Discarded packets |
| A | 0 | 137745 | 0 |
| B | 0 | 162651 | 0 |
| C | 0 | 154408 | 0 |
| D | 0 | 215383 | 0 |
| Quadrant | Total seconds | Saturated seconds | Saturation percentage |
|---|---|---|---|
| A | 66334 | 209 | 0.315072% |
| B | 66334 | 2233 | 3.366298% |
| C | 66334 | 829 | 1.249736% |
| D | 66334 | 4062 | 6.123557% |
Noise dominated data is calculated using 1-second bins in cleaned event files. If a bin has >2000 counts, and if more than 50% of those come from <1% of pixels, then it is considered to be noise-dominated and hence unusable.
| Quadrant | # 1 sec bins | Bins with >0 counts | Bins with >2000 counts | High rate bins dominated by noise | Noise dominated (total time) | Noise dominated (detector-on time) | Marked lightcurve |
|---|---|---|---|---|---|---|---|
| A | 92626 | 66332 | 0 | 0 | 0.00% | 0.00% |  |
| B | 92626 | 66291 | 0 | 0 | 0.00% | 0.00% |  |
| C | 92626 | 66333 | 0 | 0 | 0.00% | 0.00% |  |
| D | 92626 | 66293 | 0 | 0 | 0.00% | 0.00% |  |
Top three noisy pixels from each quadrant. If the there are fewer than three noisy pixels in the level2.evt file, extra rows are filled as -1
| Pixel properties | Quadrant properties | ||||||
|---|---|---|---|---|---|---|---|
| Quadrant | DetID | PixID | Counts | Sigma | Mean | Median | Sigma |
| A | 9 | 19 | 3271 | 8.66 | 1067 | 1004 | 261.8 |
| A | 0 | 29 | 3247 | 8.57 | 1067 | 1004 | 261.8 |
| A | 7 | 110 | 3246 | 8.56 | 1067 | 1004 | 261.8 |
| B | 2 | 9 | 3267 | 11.69 | 1013 | 970 | 196.5 |
| B | 3 | 80 | 2879 | 9.71 | 1013 | 970 | 196.5 |
| B | 2 | 8 | 2713 | 8.87 | 1013 | 970 | 196.5 |
| C | 1 | 81 | 3237 | 8.5 | 1043 | 984 | 265.1 |
| C | 1 | 80 | 3108 | 8.01 | 1043 | 984 | 265.1 |
| C | 3 | 203 | 3053 | 7.8 | 1043 | 984 | 265.1 |
| D | 7 | 3 | 2431 | 6.35 | 942 | 862 | 247.2 |
| D | 4 | 160 | 2392 | 6.19 | 942 | 862 | 247.2 |
| D | 6 | 231 | 2374 | 6.12 | 942 | 862 | 247.2 |
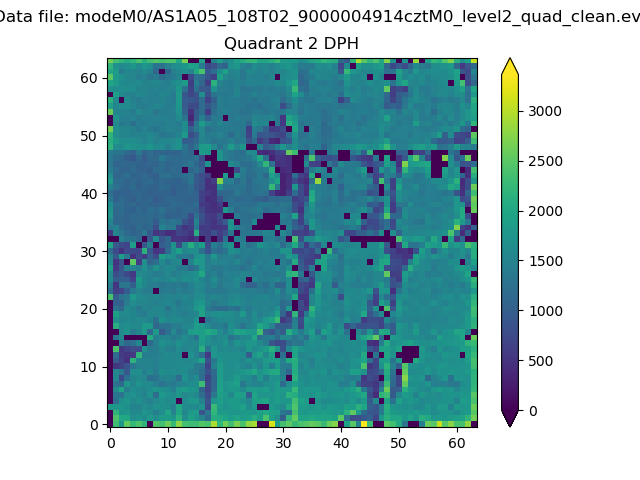
Histogram calculated using DETX and DETY for each event in the final _common_clean file
| Quadrant A |  |
 |
Quadrant B |
|---|---|---|---|
| Quadrant D | 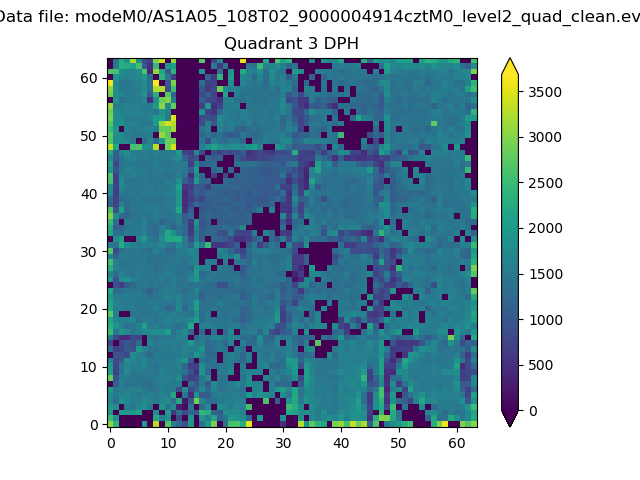 |
 |
Quadrant C |
| Plot type | Count rate plots | Images |
|---|---|---|
| Comparison with Poisson distribution Blue bars denote a histogram of data divided into 1 sec bins. Red curve is a Poisson curve with rate = median count rate of data. |
 |
 |
| Quadrant-wise count rates Data is divided into 100 sec bins |
 |
|
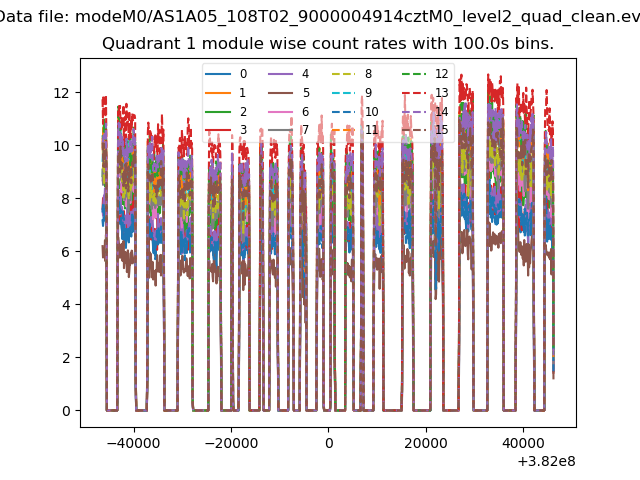
| Module-wise count rates for Quadrant A Data is divided into 100 sec bins |
 |
 |
| Module-wise count rates for Quadrant B Data is divided into 100 sec bins |
 |
 |
| Module-wise count rates for Quadrant C Data is divided into 100 sec bins |
 |
 |
| Module-wise count rates for Quadrant D Data is divided into 100 sec bins |
 |
 |
| Parameter | Plot |
|---|---|
| CZT HV Monitor | 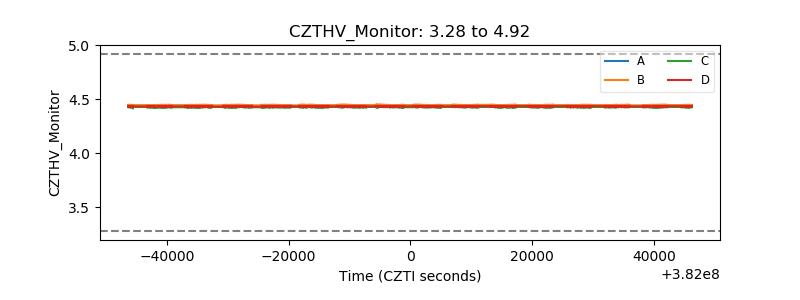 |
| D_VDD | 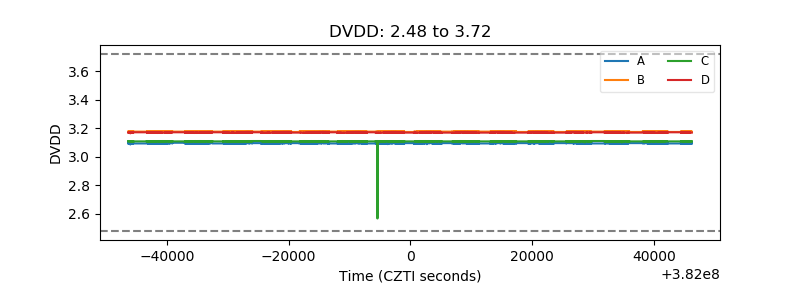 |
| Temperature 1 |  |
| Veto HV Monitor |  |
| Veto LLD |  |
| Alpha Counter |  |
| _CPM_Rate | 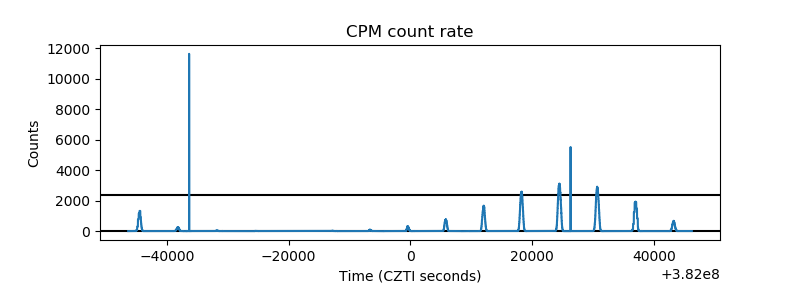 |
| CZT Counter |  |
| +2.5 Volts monitor |  |
| +5 Volts monitor |  |
| _ROLL_ROT |  |
| _Roll_DEC |  |
| _Roll_RA |  |
| Veto Counter | 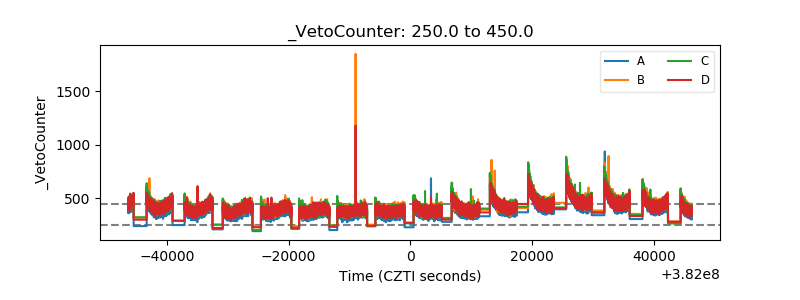 |