| Param | Original file | Final file |
|---|---|---|
| Filename | modeM0/AS1A09_038T41_9000004978cztM0_level2.fits | modeM0/AS1A09_038T41_9000004978cztM0_level2_quad_clean.evt |
| Size (bytes) | 79,508,160 | 85,201,920 |
| Size | 75.8 MB | 81.3 MB |
| Events in quadrant A | 497,310 | 530,913 |
| Events in quadrant B | 471,776 | 530,443 |
| Events in quadrant C | 490,416 | 525,496 |
| Events in quadrant D | 413,442 | 457,404 |
| Mode SS | |||
|---|---|---|---|
| Quadrant | BADHDUFLAG | Total packets | Discarded packets |
| A | 0 | 154 | 0 |
| B | 0 | 154 | 0 |
| C | 0 | 154 | 0 |
| D | 0 | 154 | 0 |
| Mode M9 | |||
|---|---|---|---|
| Quadrant | BADHDUFLAG | Total packets | Discarded packets |
| A | 0 | 42 | 0 |
| B | 0 | 42 | 0 |
| C | 0 | 42 | 0 |
| D | 0 | 42 | 0 |
| Mode M0 | |||
|---|---|---|---|
| Quadrant | BADHDUFLAG | Total packets | Discarded packets |
| A | 0 | 21243 | 0 |
| B | 0 | 18503 | 0 |
| C | 0 | 16483 | 0 |
| D | 0 | 26419 | 0 |
| Quadrant | Total seconds | Saturated seconds | Saturation percentage |
|---|---|---|---|
| A | 7701 | 40 | 0.519413% |
| B | 7701 | 194 | 2.519153% |
| C | 7701 | 40 | 0.519413% |
| D | 7701 | 287 | 3.726789% |
Noise dominated data is calculated using 1-second bins in cleaned event files. If a bin has >2000 counts, and if more than 50% of those come from <1% of pixels, then it is considered to be noise-dominated and hence unusable.
| Quadrant | # 1 sec bins | Bins with >0 counts | Bins with >2000 counts | High rate bins dominated by noise | Noise dominated (total time) | Noise dominated (detector-on time) | Marked lightcurve |
|---|---|---|---|---|---|---|---|
| A | 9824 | 7700 | 0 | 0 | 0.00% | 0.00% |  |
| B | 9824 | 7699 | 0 | 0 | 0.00% | 0.00% |  |
| C | 9824 | 7700 | 0 | 0 | 0.00% | 0.00% |  |
| D | 9824 | 7696 | 0 | 0 | 0.00% | 0.00% |  |
Top three noisy pixels from each quadrant. If the there are fewer than three noisy pixels in the level2.evt file, extra rows are filled as -1
| Pixel properties | Quadrant properties | ||||||
|---|---|---|---|---|---|---|---|
| Quadrant | DetID | PixID | Counts | Sigma | Mean | Median | Sigma |
| A | 9 | 19 | 404 | 8.42 | 130 | 124 | 33.3 |
| A | 7 | 110 | 400 | 8.3 | 130 | 124 | 33.3 |
| A | 0 | 29 | 395 | 8.15 | 130 | 124 | 33.3 |
| B | 2 | 9 | 393 | 10.11 | 125 | 121 | 26.9 |
| B | 3 | 80 | 378 | 9.55 | 125 | 121 | 26.9 |
| B | 5 | 128 | 365 | 9.07 | 125 | 121 | 26.9 |
| C | 1 | 81 | 398 | 8.05 | 129 | 123 | 34.2 |
| C | 3 | 202 | 394 | 7.93 | 129 | 123 | 34.2 |
| C | 3 | 203 | 382 | 7.58 | 129 | 123 | 34.2 |
| D | 10 | 189 | 311 | 6.25 | 118 | 108 | 32.5 |
| D | 7 | 3 | 310 | 6.22 | 118 | 108 | 32.5 |
| D | 6 | 38 | 293 | 5.7 | 118 | 108 | 32.5 |
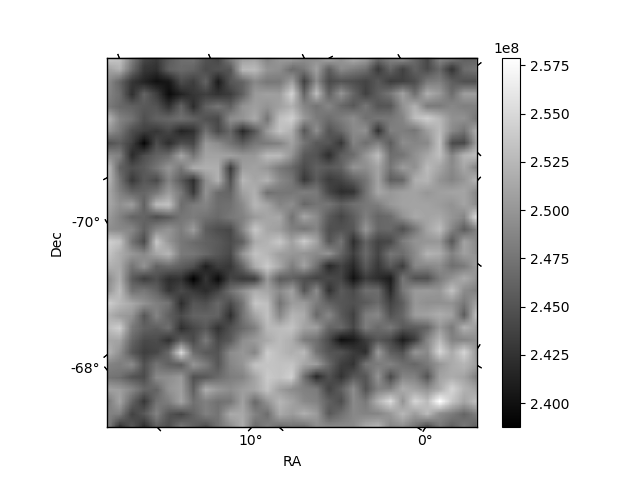
Histogram calculated using DETX and DETY for each event in the final _common_clean file
| Quadrant A |  |
 |
Quadrant B |
|---|---|---|---|
| Quadrant D | 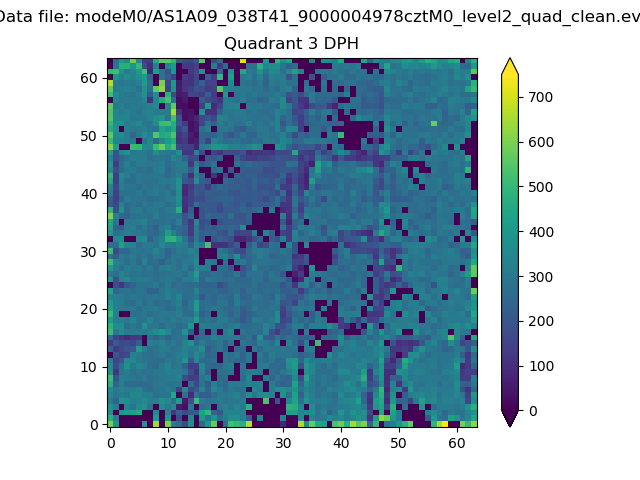 |
 |
Quadrant C |
| Plot type | Count rate plots | Images |
|---|---|---|
| Comparison with Poisson distribution Blue bars denote a histogram of data divided into 1 sec bins. Red curve is a Poisson curve with rate = median count rate of data. |
 |
 |
| Quadrant-wise count rates Data is divided into 100 sec bins |
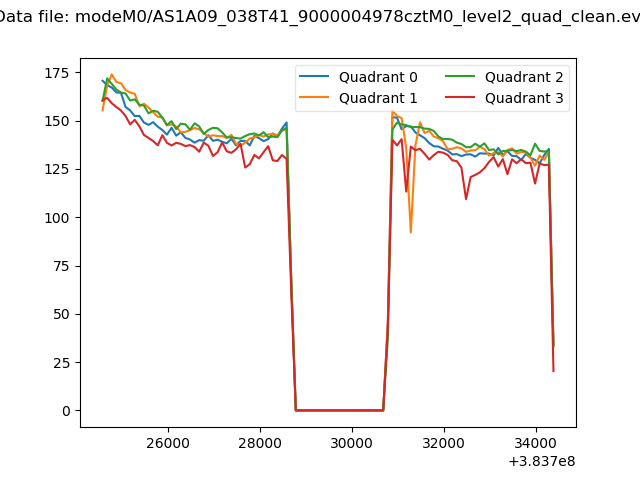 |
|
| Module-wise count rates for Quadrant A Data is divided into 100 sec bins |
 |
 |
| Module-wise count rates for Quadrant B Data is divided into 100 sec bins |
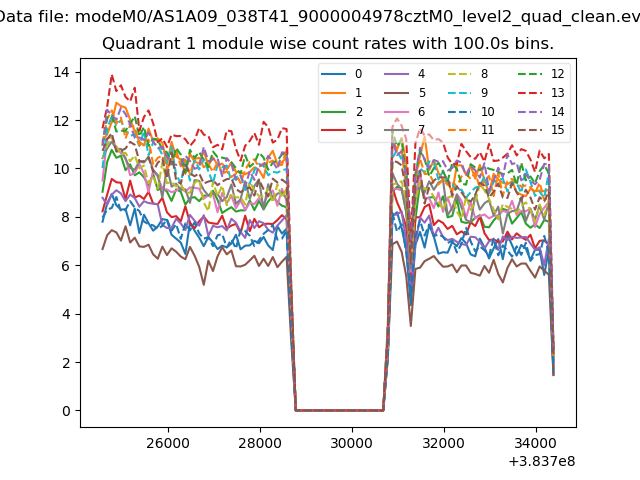 |
 |
| Module-wise count rates for Quadrant C Data is divided into 100 sec bins |
 |
 |
| Module-wise count rates for Quadrant D Data is divided into 100 sec bins |
 |
 |
| Parameter | Plot |
|---|---|
| CZT HV Monitor |  |
| D_VDD |  |
| Temperature 1 |  |
| Veto HV Monitor |  |
| Veto LLD |  |
| Alpha Counter | 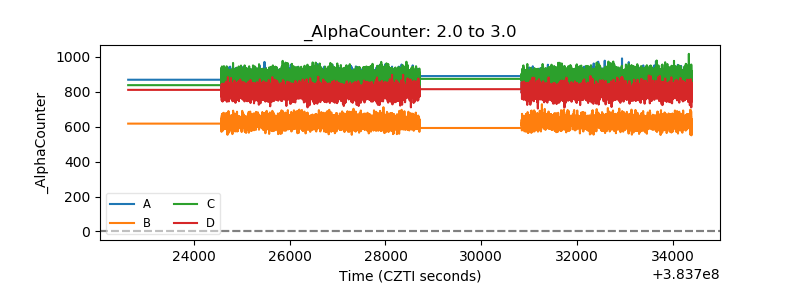 |
| _CPM_Rate |  |
| CZT Counter |  |
| +2.5 Volts monitor | 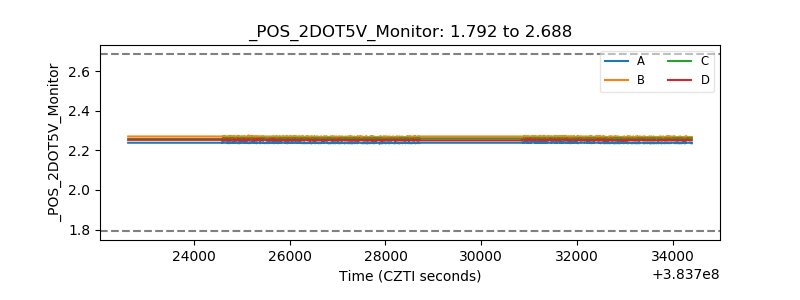 |
| +5 Volts monitor |  |
| _ROLL_ROT | 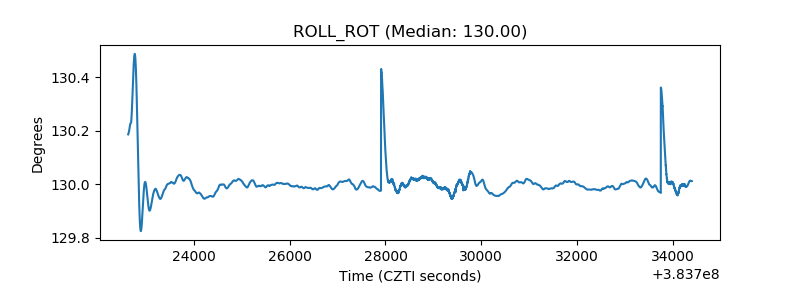 |
| _Roll_DEC |  |
| _Roll_RA |  |
| Veto Counter |  |