| Param | Original file | Final file |
|---|---|---|
| Filename | modeM0/AS1C07_006T02_9000004980cztM0_level2.fits | modeM0/AS1C07_006T02_9000004980cztM0_level2_quad_clean.evt |
| Size (bytes) | 37,281,600 | 11,698,560 |
| Size | 35.6 MB | 11.2 MB |
| Events in quadrant A | 226,620 | 20,758 |
| Events in quadrant B | 216,058 | 20,883 |
| Events in quadrant C | 222,564 | 20,311 |
| Events in quadrant D | 191,644 | 18,538 |
| Mode M0 | |||
|---|---|---|---|
| Quadrant | BADHDUFLAG | Total packets | Discarded packets |
| A | 0 | 8583 | 0 |
| B | 0 | 8927 | 0 |
| C | 0 | 8174 | 0 |
| D | 0 | 11519 | 0 |
| Mode M9 | |||
|---|---|---|---|
| Quadrant | BADHDUFLAG | Total packets | Discarded packets |
| A | 0 | 13 | 0 |
| B | 0 | 13 | 0 |
| C | 0 | 13 | 0 |
| D | 0 | 13 | 0 |
| Mode SS | |||
|---|---|---|---|
| Quadrant | BADHDUFLAG | Total packets | Discarded packets |
| A | 0 | 78 | 0 |
| B | 0 | 78 | 0 |
| C | 0 | 78 | 0 |
| D | 0 | 78 | 0 |
| Quadrant | Total seconds | Saturated seconds | Saturation percentage |
|---|---|---|---|
| A | 3854 | 2 | 0.051894% |
| B | 3854 | 78 | 2.023871% |
| C | 3854 | 26 | 0.674624% |
| D | 3854 | 32 | 0.830306% |
Noise dominated data is calculated using 1-second bins in cleaned event files. If a bin has >2000 counts, and if more than 50% of those come from <1% of pixels, then it is considered to be noise-dominated and hence unusable.
| Quadrant | # 1 sec bins | Bins with >0 counts | Bins with >2000 counts | High rate bins dominated by noise | Noise dominated (total time) | Noise dominated (detector-on time) | Marked lightcurve |
|---|---|---|---|---|---|---|---|
| A | 3853 | 3853 | 0 | 0 | 0.00% | 0.00% |  |
| B | 3853 | 3853 | 0 | 0 | 0.00% | 0.00% |  |
| C | 3853 | 3853 | 0 | 0 | 0.00% | 0.00% |  |
| D | 3853 | 3853 | 0 | 0 | 0.00% | 0.00% |  |
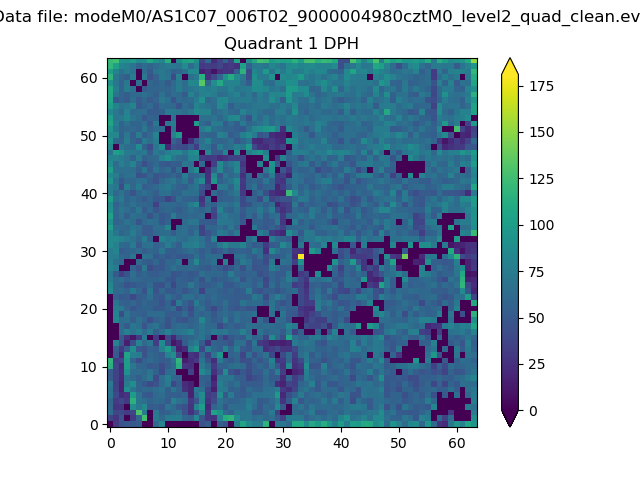
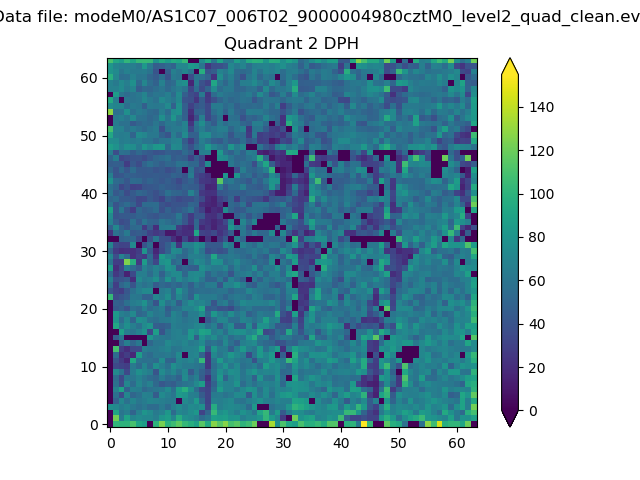
Top three noisy pixels from each quadrant. If the there are fewer than three noisy pixels in the level2.evt file, extra rows are filled as -1
| Pixel properties | Quadrant properties | ||||||
|---|---|---|---|---|---|---|---|
| Quadrant | DetID | PixID | Counts | Sigma | Mean | Median | Sigma |
| A | 14 | 79 | 192 | 8.23 | 59 | 56 | 16.5 |
| A | 0 | 29 | 188 | 7.98 | 59 | 56 | 16.5 |
| A | 9 | 19 | 186 | 7.86 | 59 | 56 | 16.5 |
| B | 2 | 9 | 177 | 9.12 | 57 | 54 | 13.5 |
| B | 3 | 80 | 173 | 8.82 | 57 | 54 | 13.5 |
| B | 5 | 225 | 148 | 6.97 | 57 | 54 | 13.5 |
| C | 1 | 81 | 201 | 8.83 | 58 | 55 | 16.5 |
| C | 1 | 80 | 174 | 7.19 | 58 | 55 | 16.5 |
| C | 9 | 188 | 163 | 6.53 | 58 | 55 | 16.5 |
| D | 4 | 160 | 152 | 6.41 | 54 | 49 | 16.1 |
| D | 10 | 189 | 145 | 5.97 | 54 | 49 | 16.1 |
| D | 10 | 113 | 145 | 5.97 | 54 | 49 | 16.1 |
Histogram calculated using DETX and DETY for each event in the final _common_clean file
| Quadrant A | 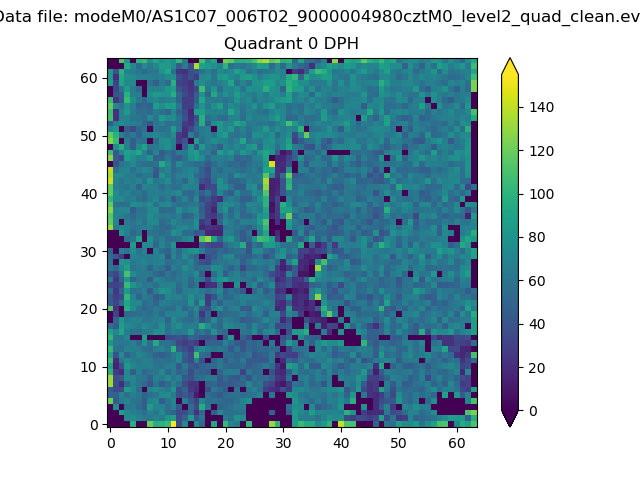 |
 |
Quadrant B |
|---|---|---|---|
| Quadrant D | 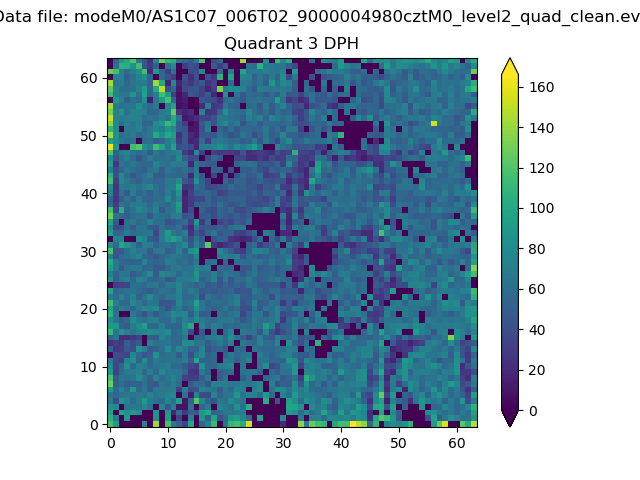 |
 |
Quadrant C |
| Plot type | Count rate plots | Images |
|---|---|---|
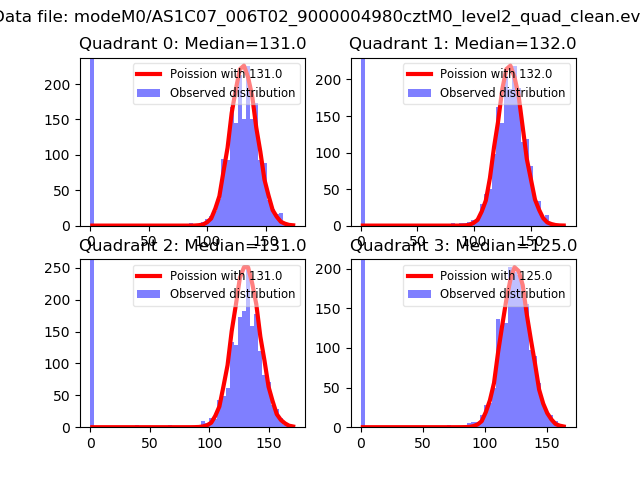
| Comparison with Poisson distribution Blue bars denote a histogram of data divided into 1 sec bins. Red curve is a Poisson curve with rate = median count rate of data. |
 |
 |
| Quadrant-wise count rates Data is divided into 100 sec bins |
 |
|
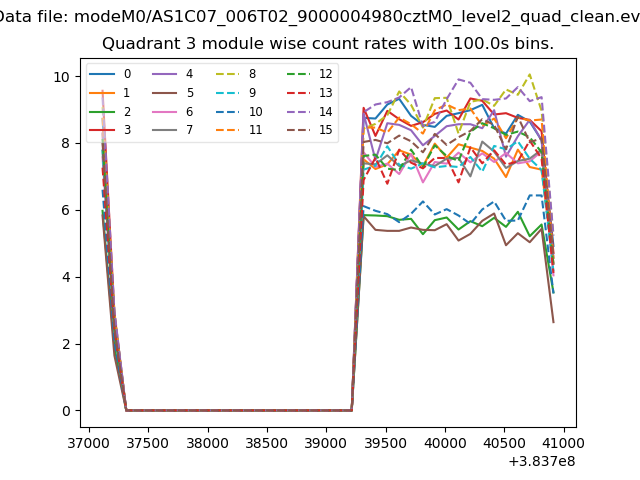
| Module-wise count rates for Quadrant A Data is divided into 100 sec bins |
 |
 |
| Module-wise count rates for Quadrant B Data is divided into 100 sec bins |
 |
 |
| Module-wise count rates for Quadrant C Data is divided into 100 sec bins |
 |
 |
| Module-wise count rates for Quadrant D Data is divided into 100 sec bins |
 |
 |
| Parameter | Plot |
|---|---|
| CZT HV Monitor |  |
| D_VDD | 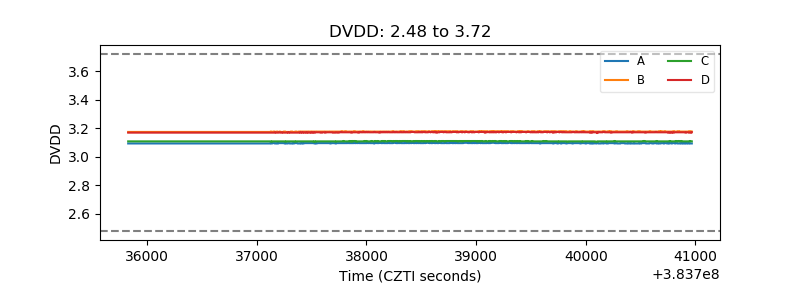 |
| Temperature 1 | 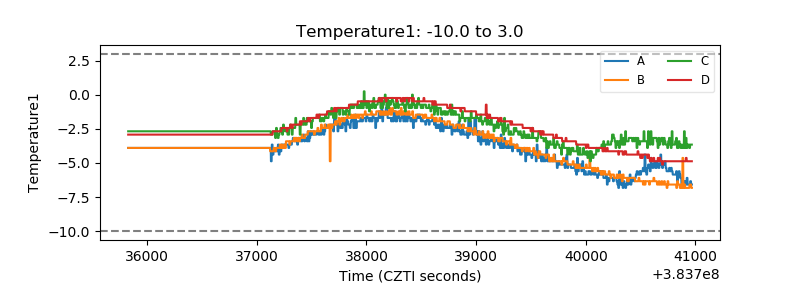 |
| Veto HV Monitor |  |
| Veto LLD |  |
| Alpha Counter |  |
| _CPM_Rate | 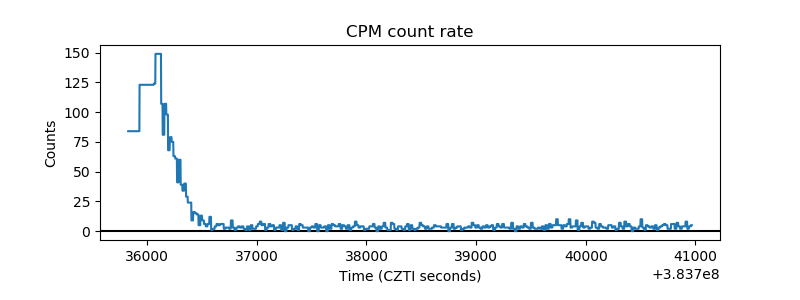 |
| CZT Counter |  |
| +2.5 Volts monitor |  |
| +5 Volts monitor |  |
| _ROLL_ROT |  |
| _Roll_DEC | 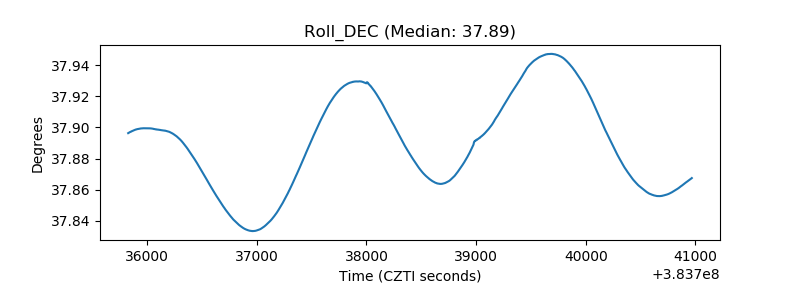 |
| _Roll_RA | 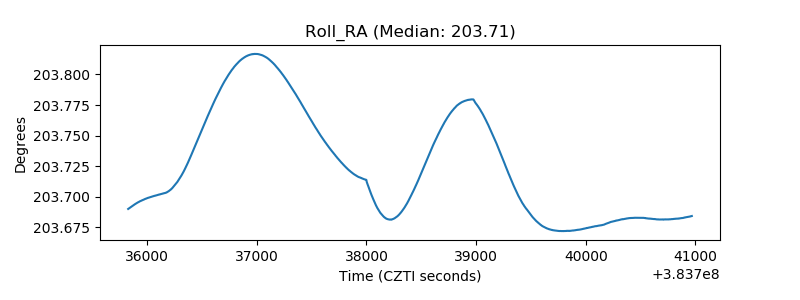 |
| Veto Counter |  |