| Param | Original file | Final file |
|---|---|---|
| Filename | modeM0/AS1A11_065T05_9000005032cztM0_level2.fits | modeM0/AS1A11_065T05_9000005032cztM0_level2_quad_clean.evt |
| Size (bytes) | 142,830,720 | 82,687,680 |
| Size | 136.2 MB | 78.9 MB |
| Events in quadrant A | 910,768 | 411,488 |
| Events in quadrant B | 860,250 | 411,392 |
| Events in quadrant C | 876,134 | 403,064 |
| Events in quadrant D | 741,784 | 340,378 |
| Mode M0 | |||
|---|---|---|---|
| Quadrant | BADHDUFLAG | Total packets | Discarded packets |
| A | 0 | 41834 | 0 |
| B | 0 | 38827 | 0 |
| C | 0 | 33311 | 0 |
| D | 0 | 57310 | 0 |
| Mode M9 | |||
|---|---|---|---|
| Quadrant | BADHDUFLAG | Total packets | Discarded packets |
| A | 0 | 78 | 0 |
| B | 0 | 78 | 0 |
| C | 0 | 78 | 0 |
| D | 0 | 78 | 0 |
| Mode SS | |||
|---|---|---|---|
| Quadrant | BADHDUFLAG | Total packets | Discarded packets |
| A | 0 | 276 | 0 |
| B | 0 | 276 | 0 |
| C | 0 | 276 | 0 |
| D | 0 | 276 | 0 |
| Quadrant | Total seconds | Saturated seconds | Saturation percentage |
|---|---|---|---|
| A | 13552 | 1165 | 8.596517% |
| B | 13552 | 717 | 5.290732% |
| C | 13552 | 367 | 2.708087% |
| D | 13552 | 1129 | 8.330874% |
Noise dominated data is calculated using 1-second bins in cleaned event files. If a bin has >2000 counts, and if more than 50% of those come from <1% of pixels, then it is considered to be noise-dominated and hence unusable.
| Quadrant | # 1 sec bins | Bins with >0 counts | Bins with >2000 counts | High rate bins dominated by noise | Noise dominated (total time) | Noise dominated (detector-on time) | Marked lightcurve |
|---|---|---|---|---|---|---|---|
| A | 19920 | 13551 | 0 | 0 | 0.00% | 0.00% |  |
| B | 19920 | 13551 | 0 | 0 | 0.00% | 0.00% |  |
| C | 19920 | 13547 | 0 | 0 | 0.00% | 0.00% |  |
| D | 19920 | 13517 | 0 | 0 | 0.00% | 0.00% |  |
Top three noisy pixels from each quadrant. If the there are fewer than three noisy pixels in the level2.evt file, extra rows are filled as -1
| Pixel properties | Quadrant properties | ||||||
|---|---|---|---|---|---|---|---|
| Quadrant | DetID | PixID | Counts | Sigma | Mean | Median | Sigma |
| A | 7 | 110 | 765 | 9.4 | 237 | 226 | 57.4 |
| A | 0 | 29 | 712 | 8.47 | 237 | 226 | 57.4 |
| A | 9 | 19 | 704 | 8.33 | 237 | 226 | 57.4 |
| B | 2 | 9 | 693 | 10.24 | 228 | 220 | 46.2 |
| B | 3 | 80 | 672 | 9.78 | 228 | 220 | 46.2 |
| B | 2 | 8 | 573 | 7.64 | 228 | 220 | 46.2 |
| C | 3 | 203 | 672 | 7.38 | 232 | 220 | 61.2 |
| C | 3 | 202 | 626 | 6.63 | 232 | 220 | 61.2 |
| C | 1 | 65 | 610 | 6.37 | 232 | 220 | 61.2 |
| D | 10 | 189 | 610 | 7.18 | 213 | 196 | 57.6 |
| D | 4 | 160 | 530 | 5.79 | 213 | 196 | 57.6 |
| D | 7 | 3 | 527 | 5.74 | 213 | 196 | 57.6 |
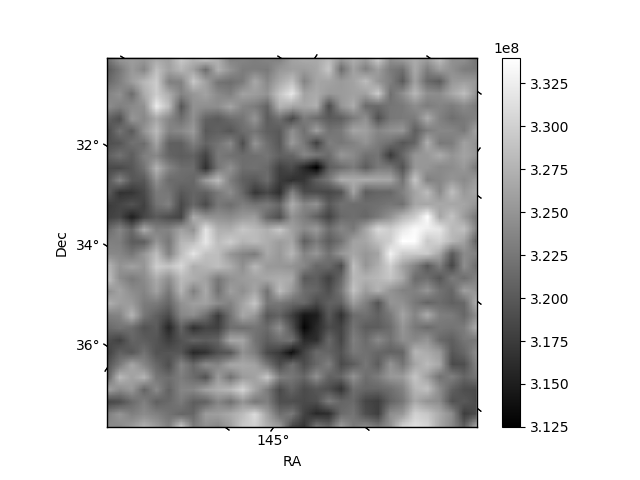
Histogram calculated using DETX and DETY for each event in the final _common_clean file
| Quadrant A | 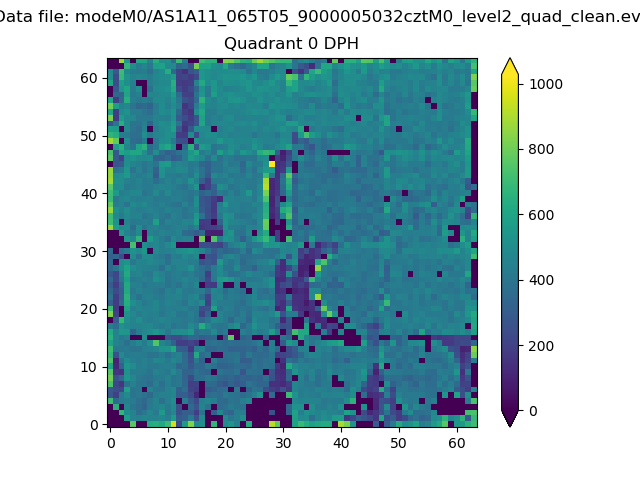 |
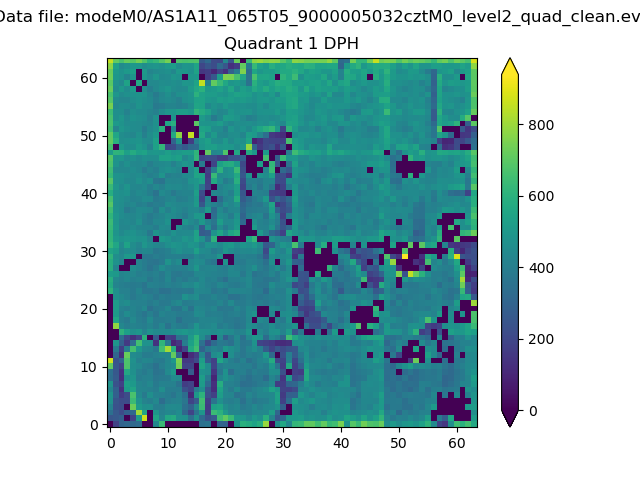 |
Quadrant B |
|---|---|---|---|
| Quadrant D |  |
 |
Quadrant C |
| Plot type | Count rate plots | Images |
|---|---|---|
| Comparison with Poisson distribution Blue bars denote a histogram of data divided into 1 sec bins. Red curve is a Poisson curve with rate = median count rate of data. |
 |
 |
| Quadrant-wise count rates Data is divided into 100 sec bins |
 |
|
| Module-wise count rates for Quadrant A Data is divided into 100 sec bins |
 |
 |
| Module-wise count rates for Quadrant B Data is divided into 100 sec bins |
 |
 |
| Module-wise count rates for Quadrant C Data is divided into 100 sec bins |
 |
 |
| Module-wise count rates for Quadrant D Data is divided into 100 sec bins |
 |
 |
| Parameter | Plot |
|---|---|
| CZT HV Monitor |  |
| D_VDD | 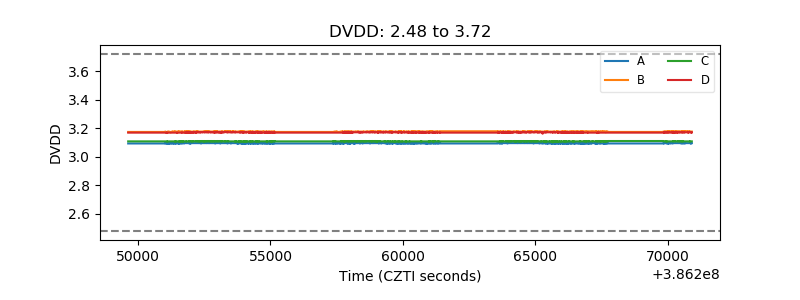 |
| Temperature 1 | 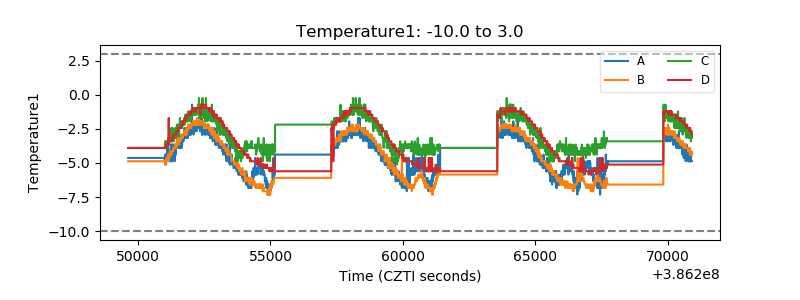 |
| Veto HV Monitor |  |
| Veto LLD |  |
| Alpha Counter | 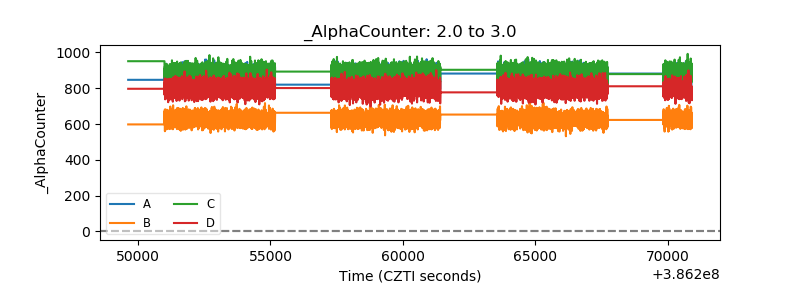 |
| _CPM_Rate | 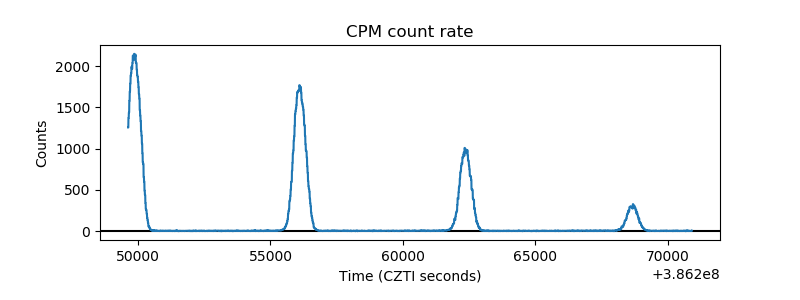 |
| CZT Counter | 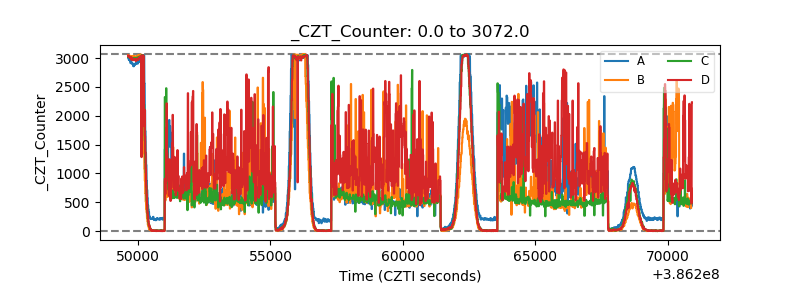 |
| +2.5 Volts monitor |  |
| +5 Volts monitor |  |
| _ROLL_ROT | 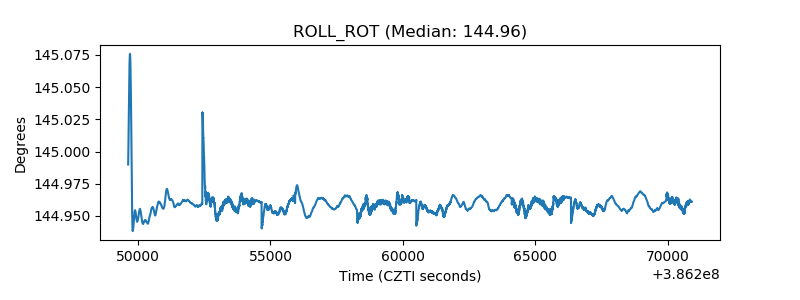 |
| _Roll_DEC | 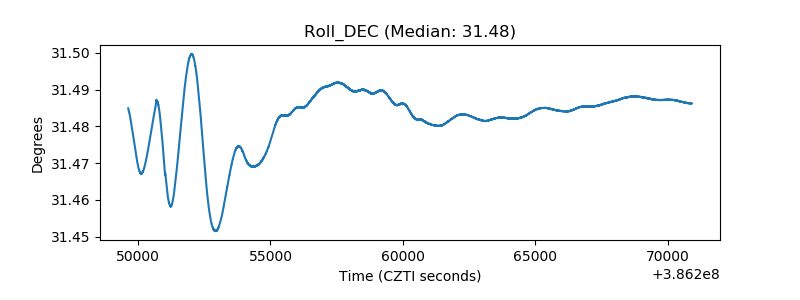 |
| _Roll_RA | 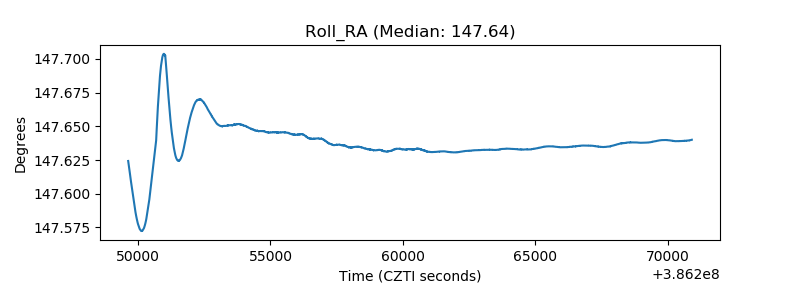 |
| Veto Counter |  |