| Param | Original file | Final file |
|---|---|---|
| Filename | modeM0/AS1A11_093T01_9000005090cztM0_level2.fits | modeM0/AS1A11_093T01_9000005090cztM0_level2_quad_clean.evt |
| Size (bytes) | 497,960,640 | 484,568,640 |
| Size | 474.9 MB | 462.1 MB |
| Events in quadrant A | 2,127,186 | 1,883,016 |
| Events in quadrant B | 3,091,920 | 3,070,661 |
| Events in quadrant C | 3,239,734 | 3,104,668 |
| Events in quadrant D | 2,770,902 | 2,777,627 |
| Mode SS | |||
|---|---|---|---|
| Quadrant | BADHDUFLAG | Total packets | Discarded packets |
| A | 0 | 1142 | 0 |
| B | 0 | 1142 | 0 |
| C | 0 | 1142 | 0 |
| D | 0 | 1142 | 0 |
| Mode M0 | |||
|---|---|---|---|
| Quadrant | BADHDUFLAG | Total packets | Discarded packets |
| A | 0 | 269293 | 0 |
| B | 0 | 133233 | 0 |
| C | 0 | 124611 | 0 |
| D | 0 | 136318 | 0 |
| Mode M9 | |||
|---|---|---|---|
| Quadrant | BADHDUFLAG | Total packets | Discarded packets |
| A | 0 | 211 | 0 |
| B | 0 | 211 | 0 |
| C | 0 | 211 | 0 |
| D | 0 | 211 | 0 |
| Quadrant | Total seconds | Saturated seconds | Saturation percentage |
|---|---|---|---|
| A | 55953 | 24171 | 43.198756% |
| B | 55953 | 1968 | 3.517238% |
| C | 55953 | 783 | 1.399389% |
| D | 55953 | 1462 | 2.612907% |
Noise dominated data is calculated using 1-second bins in cleaned event files. If a bin has >2000 counts, and if more than 50% of those come from <1% of pixels, then it is considered to be noise-dominated and hence unusable.
| Quadrant | # 1 sec bins | Bins with >0 counts | Bins with >2000 counts | High rate bins dominated by noise | Noise dominated (total time) | Noise dominated (detector-on time) | Marked lightcurve |
|---|---|---|---|---|---|---|---|
| A | 77075 | 52704 | 0 | 0 | 0.00% | 0.00% |  |
| B | 77075 | 55950 | 0 | 0 | 0.00% | 0.00% |  |
| C | 77075 | 55946 | 0 | 0 | 0.00% | 0.00% |  |
| D | 77075 | 55941 | 0 | 0 | 0.00% | 0.00% |  |
Top three noisy pixels from each quadrant. If the there are fewer than three noisy pixels in the level2.evt file, extra rows are filled as -1
| Pixel properties | Quadrant properties | ||||||
|---|---|---|---|---|---|---|---|
| Quadrant | DetID | PixID | Counts | Sigma | Mean | Median | Sigma |
| A | 7 | 110 | 1748 | 8.86 | 554 | 523 | 138.3 |
| A | 9 | 19 | 1738 | 8.79 | 554 | 523 | 138.3 |
| A | 0 | 29 | 1644 | 8.11 | 554 | 523 | 138.3 |
| B | 2 | 9 | 2637 | 11.62 | 818 | 783 | 159.5 |
| B | 3 | 80 | 2356 | 9.86 | 818 | 783 | 159.5 |
| B | 2 | 8 | 2180 | 8.76 | 818 | 783 | 159.5 |
| C | 1 | 81 | 2661 | 8.47 | 855 | 808 | 218.7 |
| C | 1 | 80 | 2639 | 8.37 | 855 | 808 | 218.7 |
| C | 3 | 203 | 2630 | 8.33 | 855 | 808 | 218.7 |
| D | 10 | 189 | 2054 | 6.29 | 792 | 726 | 210.9 |
| D | 10 | 113 | 2034 | 6.2 | 792 | 726 | 210.9 |
| D | 3 | 14 | 2030 | 6.18 | 792 | 726 | 210.9 |
Histogram calculated using DETX and DETY for each event in the final _common_clean file
| Quadrant A | 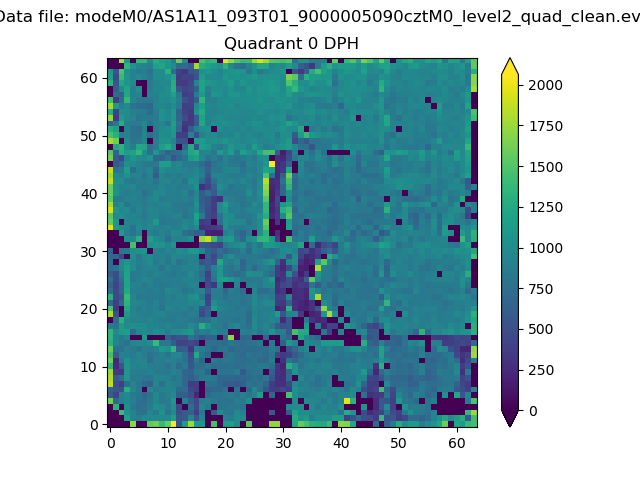 |
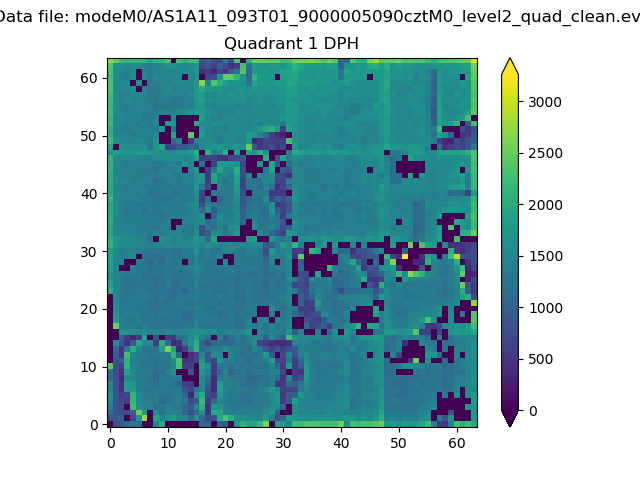 |
Quadrant B |
|---|---|---|---|
| Quadrant D |  |
 |
Quadrant C |
| Plot type | Count rate plots | Images |
|---|---|---|
| Comparison with Poisson distribution Blue bars denote a histogram of data divided into 1 sec bins. Red curve is a Poisson curve with rate = median count rate of data. |
 |
 |
| Quadrant-wise count rates Data is divided into 100 sec bins |
 |
|
| Module-wise count rates for Quadrant A Data is divided into 100 sec bins |
 |
 |
| Module-wise count rates for Quadrant B Data is divided into 100 sec bins |
 |
 |
| Module-wise count rates for Quadrant C Data is divided into 100 sec bins |
 |
 |
| Module-wise count rates for Quadrant D Data is divided into 100 sec bins |
 |
 |
| Parameter | Plot |
|---|---|
| CZT HV Monitor |  |
| D_VDD |  |
| Temperature 1 |  |
| Veto HV Monitor |  |
| Veto LLD |  |
| Alpha Counter |  |
| _CPM_Rate |  |
| CZT Counter | 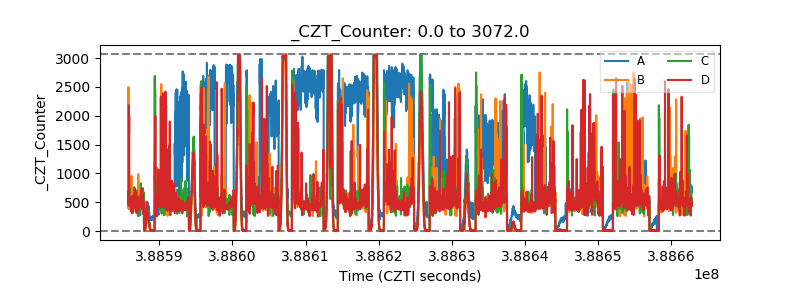 |
| +2.5 Volts monitor |  |
| +5 Volts monitor |  |
| _ROLL_ROT |  |
| _Roll_DEC |  |
| _Roll_RA |  |
| Veto Counter |  |