| Param | Original file | Final file |
|---|---|---|
| Filename | modeM0/AS1A09_029T07_9000005128cztM0_level2.fits | modeM0/AS1A09_029T07_9000005128cztM0_level2_quad_clean.evt |
| Size (bytes) | 401,578,560 | 453,044,160 |
| Size | 383.0 MB | 432.1 MB |
| Events in quadrant A | 2,446,686 | 2,836,482 |
| Events in quadrant B | 2,311,794 | 2,812,950 |
| Events in quadrant C | 2,357,002 | 2,683,533 |
| Events in quadrant D | 2,027,720 | 2,369,926 |
| Mode M9 | |||
|---|---|---|---|
| Quadrant | BADHDUFLAG | Total packets | Discarded packets |
| A | 0 | 143 | 0 |
| B | 0 | 143 | 0 |
| C | 0 | 143 | 0 |
| D | 0 | 143 | 0 |
| Mode M0 | |||
|---|---|---|---|
| Quadrant | BADHDUFLAG | Total packets | Discarded packets |
| A | 0 | 90824 | 0 |
| B | 0 | 101326 | 0 |
| C | 0 | 94533 | 0 |
| D | 0 | 117695 | 0 |
| Mode SS | |||
|---|---|---|---|
| Quadrant | BADHDUFLAG | Total packets | Discarded packets |
| A | 0 | 898 | 0 |
| B | 0 | 898 | 0 |
| C | 0 | 898 | 0 |
| D | 0 | 898 | 0 |
| Quadrant | Total seconds | Saturated seconds | Saturation percentage |
|---|---|---|---|
| A | 43963 | 152 | 0.345745% |
| B | 43963 | 817 | 1.858381% |
| C | 43963 | 408 | 0.928053% |
| D | 43963 | 1784 | 4.057958% |
Noise dominated data is calculated using 1-second bins in cleaned event files. If a bin has >2000 counts, and if more than 50% of those come from <1% of pixels, then it is considered to be noise-dominated and hence unusable.
| Quadrant | # 1 sec bins | Bins with >0 counts | Bins with >2000 counts | High rate bins dominated by noise | Noise dominated (total time) | Noise dominated (detector-on time) | Marked lightcurve |
|---|---|---|---|---|---|---|---|
| A | 58297 | 43958 | 0 | 0 | 0.00% | 0.00% | 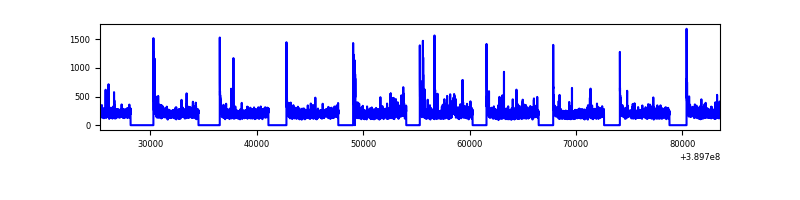 |
| B | 58297 | 43960 | 0 | 0 | 0.00% | 0.00% |  |
| C | 58297 | 43959 | 0 | 0 | 0.00% | 0.00% | 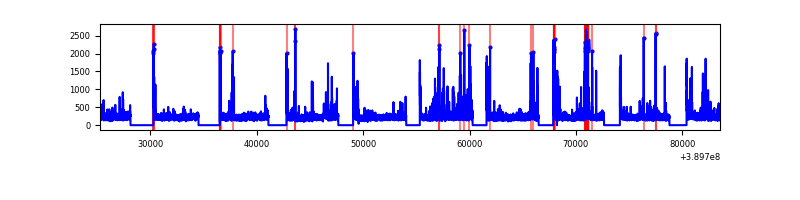 |
| D | 58297 | 43944 | 0 | 0 | 0.00% | 0.00% | 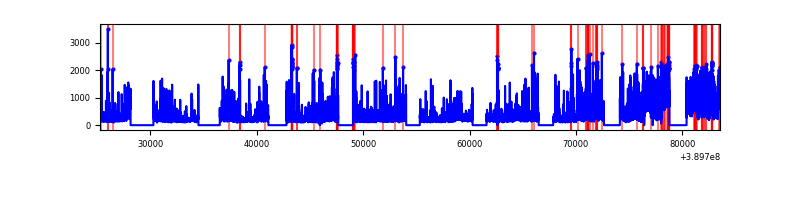 |
Top three noisy pixels from each quadrant. If the there are fewer than three noisy pixels in the level2.evt file, extra rows are filled as -1
| Pixel properties | Quadrant properties | ||||||
|---|---|---|---|---|---|---|---|
| Quadrant | DetID | PixID | Counts | Sigma | Mean | Median | Sigma |
| A | 7 | 110 | 2049 | 9.07 | 637 | 598 | 159.9 |
| A | 0 | 29 | 1918 | 8.25 | 637 | 598 | 159.9 |
| A | 9 | 19 | 1901 | 8.15 | 637 | 598 | 159.9 |
| B | 2 | 9 | 2094 | 12.58 | 611 | 582 | 120.2 |
| B | 3 | 80 | 1774 | 9.91 | 611 | 582 | 120.2 |
| B | 2 | 8 | 1698 | 9.28 | 611 | 582 | 120.2 |
| C | 1 | 80 | 1925 | 8.29 | 623 | 582 | 162.0 |
| C | 1 | 81 | 1915 | 8.23 | 623 | 582 | 162.0 |
| C | 3 | 202 | 1863 | 7.91 | 623 | 582 | 162.0 |
| D | 3 | 14 | 1524 | 6.39 | 580 | 527 | 155.9 |
| D | 6 | 38 | 1512 | 6.32 | 580 | 527 | 155.9 |
| D | 7 | 3 | 1512 | 6.32 | 580 | 527 | 155.9 |
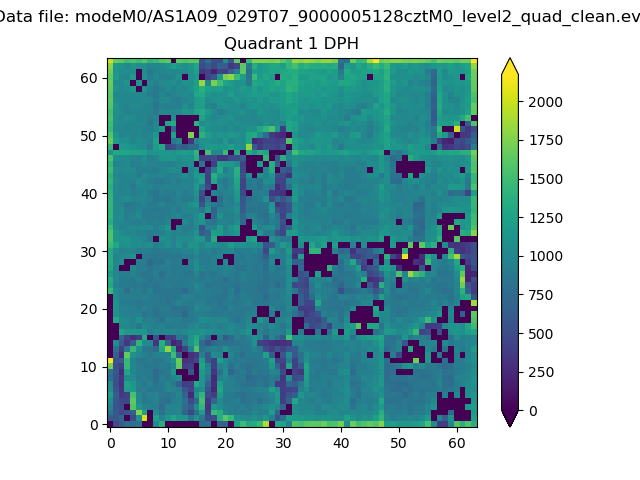
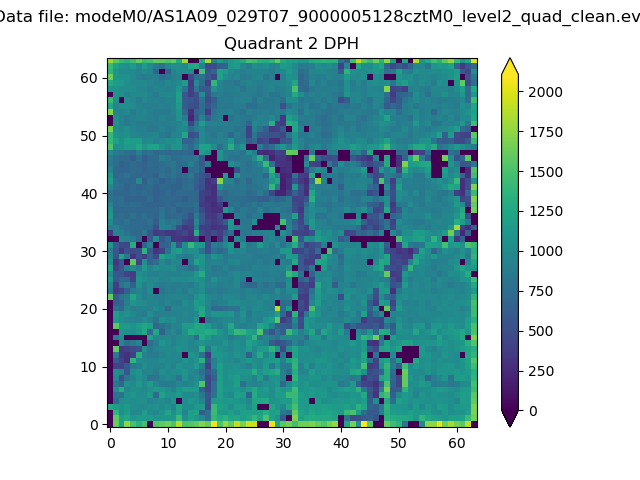
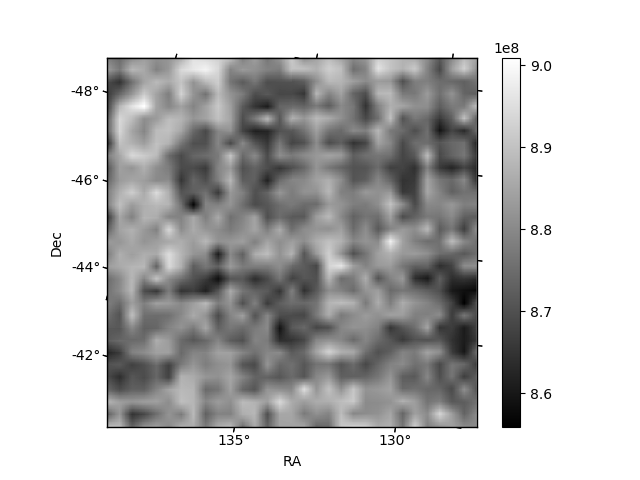
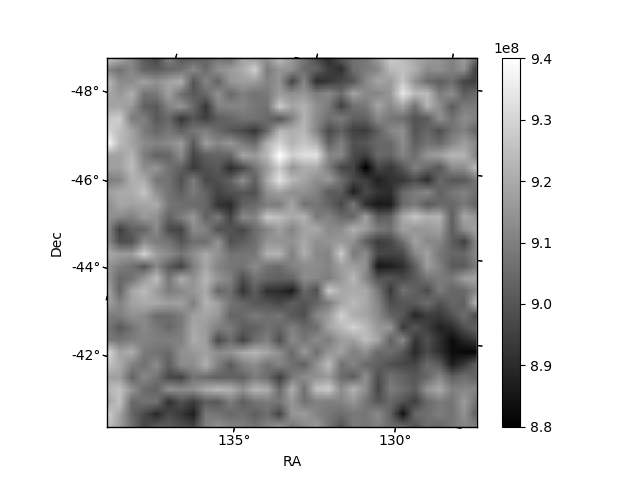
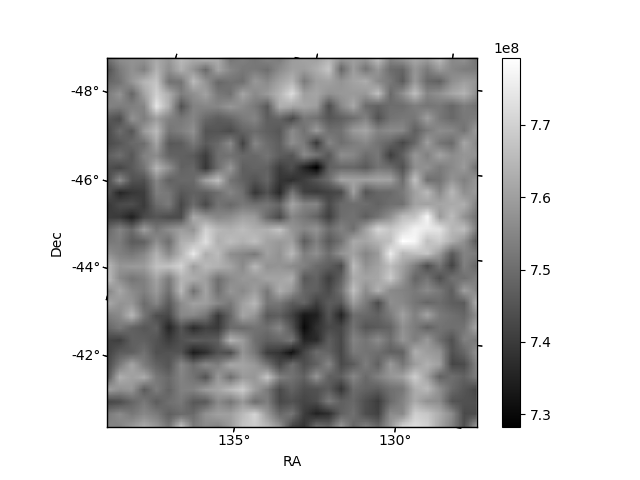
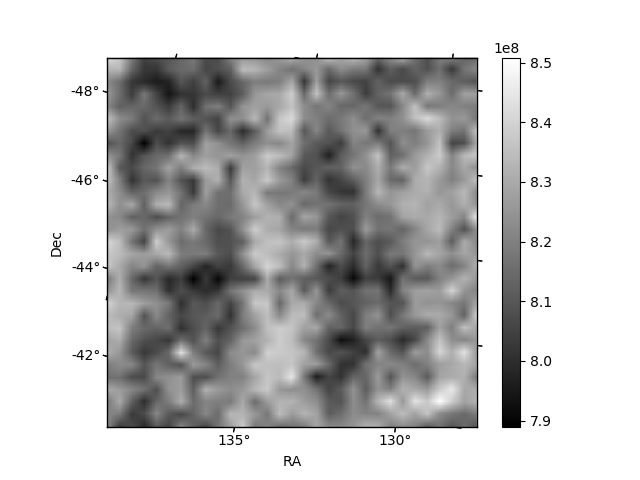
Histogram calculated using DETX and DETY for each event in the final _common_clean file
| Quadrant A | 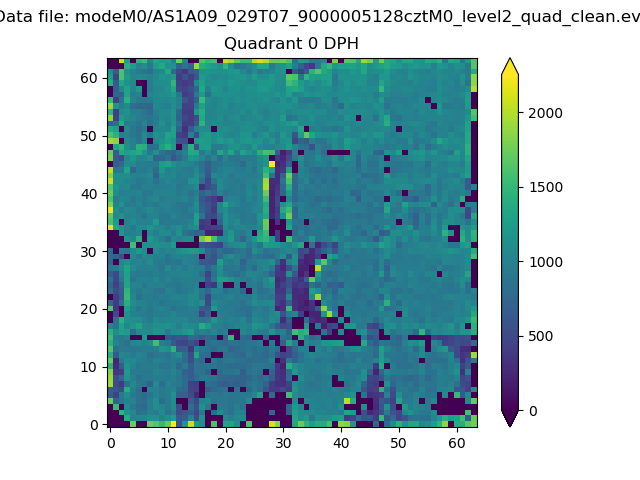 |
 |
Quadrant B |
|---|---|---|---|
| Quadrant D | 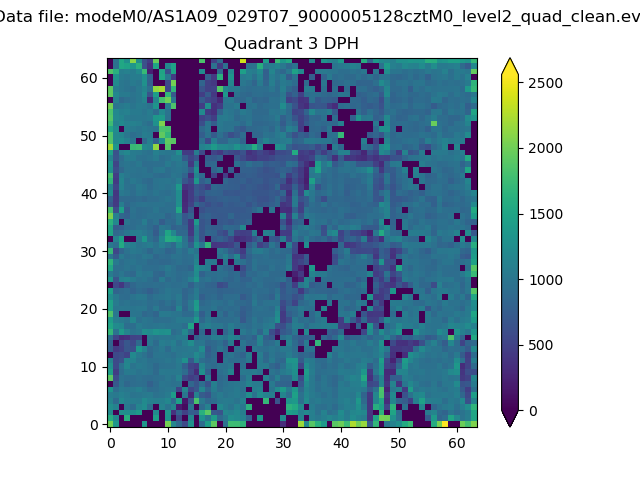 |
 |
Quadrant C |
| Plot type | Count rate plots | Images |
|---|---|---|
| Comparison with Poisson distribution Blue bars denote a histogram of data divided into 1 sec bins. Red curve is a Poisson curve with rate = median count rate of data. |
 |
 |
| Quadrant-wise count rates Data is divided into 100 sec bins |
 |
|
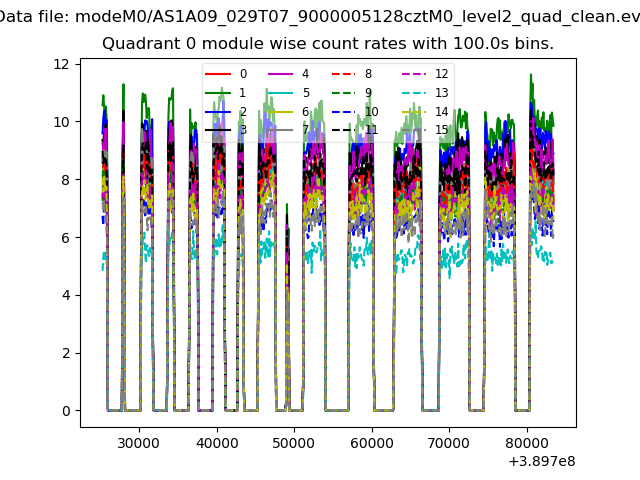
| Module-wise count rates for Quadrant A Data is divided into 100 sec bins |
 |
 |
| Module-wise count rates for Quadrant B Data is divided into 100 sec bins |
 |
 |
| Module-wise count rates for Quadrant C Data is divided into 100 sec bins |
 |
 |
| Module-wise count rates for Quadrant D Data is divided into 100 sec bins |
 |
 |
| Parameter | Plot |
|---|---|
| CZT HV Monitor |  |
| D_VDD | 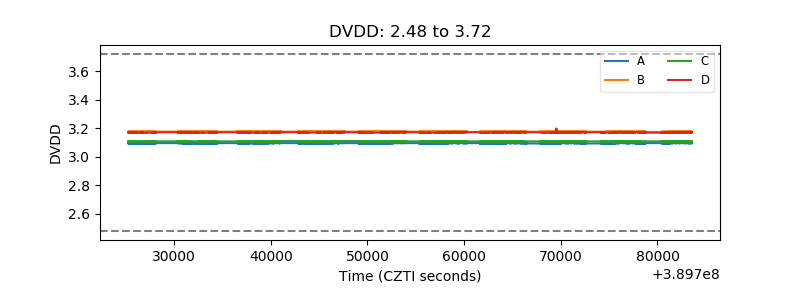 |
| Temperature 1 | 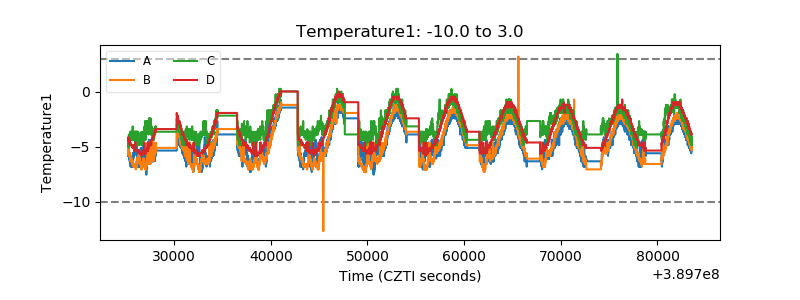 |
| Veto HV Monitor |  |
| Veto LLD | 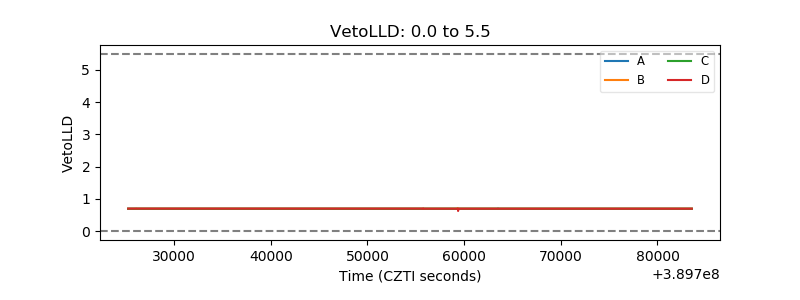 |
| Alpha Counter |  |
| _CPM_Rate | 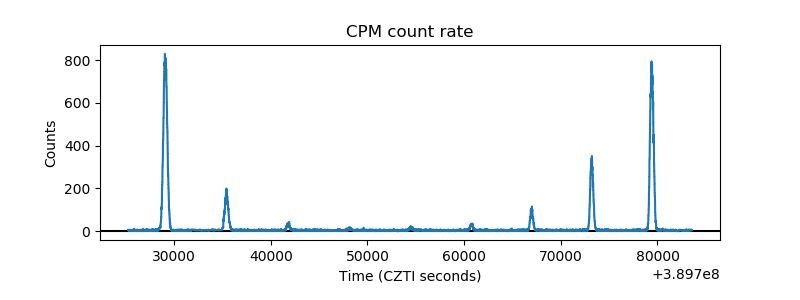 |
| CZT Counter | 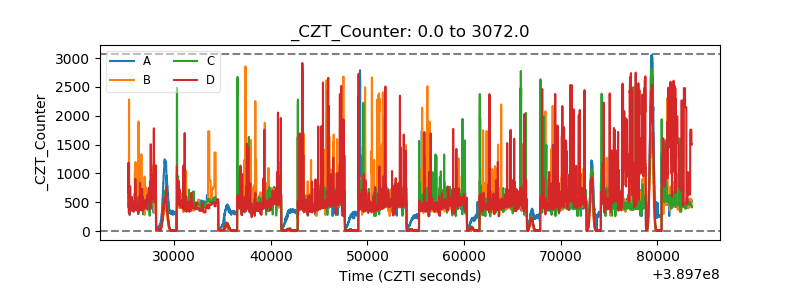 |
| +2.5 Volts monitor | 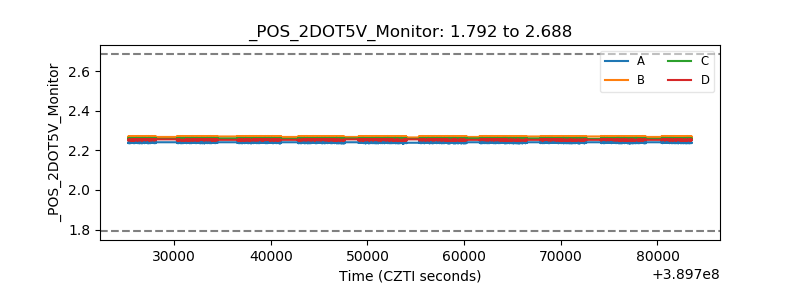 |
| +5 Volts monitor | 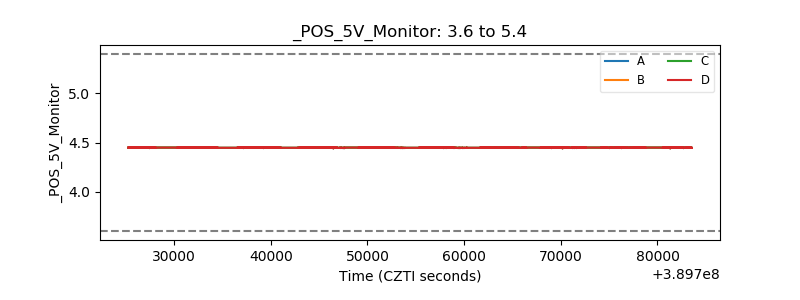 |
| _ROLL_ROT | 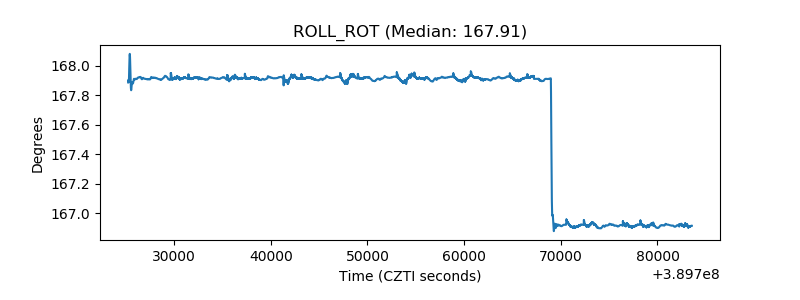 |
| _Roll_DEC |  |
| _Roll_RA | 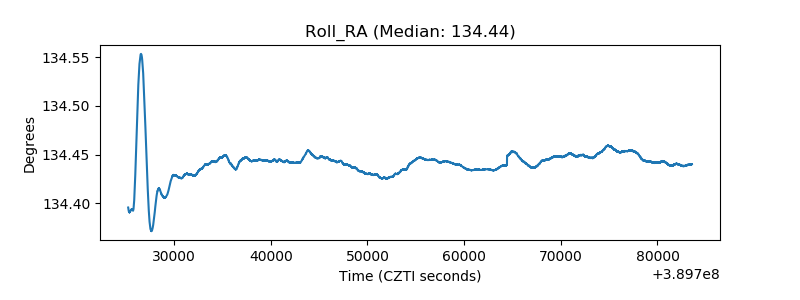 |
| Veto Counter | 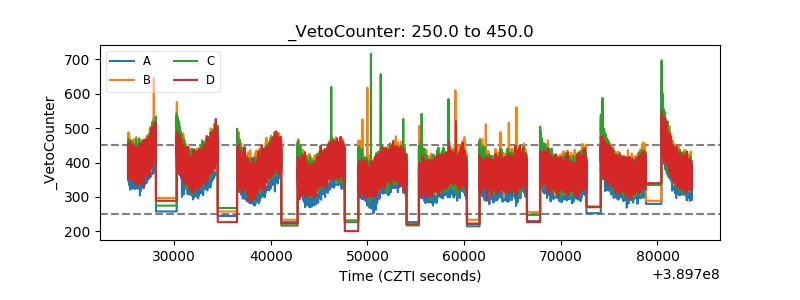 |