| Param | Original file | Final file |
|---|---|---|
| Filename | modeM0/AS1T05_009T06_9000005154cztM0_level2_bc.evt | modeM0/AS1T05_009T06_9000005154cztM0_level2_quad_clean.evt |
| Size (bytes) | 305,449,920 | 64,722,240 |
| Size | 291.3 MB | 61.7 MB |
| Events in quadrant A | 960,413 | 533,805 |
| Events in quadrant B | 4,723,601 | 172,969 |
| Events in quadrant C | 1,605,366 | 502,978 |
| Events in quadrant D | 1,695,692 | 481,680 |
| Mode M0 | |||
|---|---|---|---|
| Quadrant | BADHDUFLAG | Total packets | Discarded packets |
| A | 0 | 7825 | 0 |
| B | 0 | 32007 | 0 |
| C | 0 | 10592 | 0 |
| D | 0 | 10858 | 0 |
| Mode SS | |||
|---|---|---|---|
| Quadrant | BADHDUFLAG | Total packets | Discarded packets |
| A | 0 | 76 | 0 |
| B | 0 | 76 | 0 |
| C | 0 | 76 | 0 |
| D | 0 | 76 | 0 |
| Mode M9 | |||
|---|---|---|---|
| Quadrant | BADHDUFLAG | Total packets | Discarded packets |
| A | 0 | 18 | 0 |
| B | 0 | 18 | 0 |
| C | 0 | 18 | 0 |
| D | 0 | 18 | 0 |
| Quadrant | Total seconds | Saturated seconds | Saturation percentage |
|---|---|---|---|
| A | 3770 | 5 | 0.132626% |
| B | 3770 | 3762 | 99.787798% |
| C | 3770 | 174 | 4.615385% |
| D | 3770 | 184 | 4.880637% |
Noise dominated data is calculated using 1-second bins in cleaned event files. If a bin has >2000 counts, and if more than 50% of those come from <1% of pixels, then it is considered to be noise-dominated and hence unusable.
| Quadrant | # 1 sec bins | Bins with >0 counts | Bins with >2000 counts | High rate bins dominated by noise | Noise dominated (total time) | Noise dominated (detector-on time) | Marked lightcurve |
|---|---|---|---|---|---|---|---|
| A | 3770 | 3770 | 0 | 0 | 0.00% | 0.00% |  |
| B | 3768 | 3767 | 590 | 590 | 15.66% | 15.66% |  |
| C | 3769 | 3769 | 22 | 22 | 0.58% | 0.58% |  |
| D | 3769 | 3769 | 48 | 48 | 1.27% | 1.27% |  |
Top three noisy pixels from each quadrant. If the there are fewer than three noisy pixels in the level2.evt file, extra rows are filled as -1
| Pixel properties | Quadrant properties | ||||||
|---|---|---|---|---|---|---|---|
| Quadrant | DetID | PixID | Counts | Sigma | Mean | Median | Sigma |
| A | 10 | 83 | 102992 | 2098.46 | 214 | 211 | 49.0 |
| A | 8 | 144 | 10446 | 208.97 | 214 | 211 | 49.0 |
| A | 15 | 174 | 8320 | 165.56 | 214 | 211 | 49.0 |
| B | 5 | 31 | 2562093 | 152861.22 | 69 | 68 | 16.8 |
| B | 5 | 15 | 1783509 | 106407.62 | 69 | 68 | 16.8 |
| B | 0 | 190 | 50729 | 3022.65 | 69 | 68 | 16.8 |
| C | 9 | 187 | 427009 | 9079.58 | 199 | 197 | 47.0 |
| C | 0 | 207 | 188395 | 4003.54 | 199 | 197 | 47.0 |
| C | 15 | 214 | 149862 | 3183.83 | 199 | 197 | 47.0 |
| D | 2 | 250 | 203483 | 4142.15 | 202 | 196 | 49.1 |
| D | 12 | 17 | 183249 | 3729.86 | 202 | 196 | 49.1 |
| D | 1 | 52 | 124466 | 2532.11 | 202 | 196 | 49.1 |
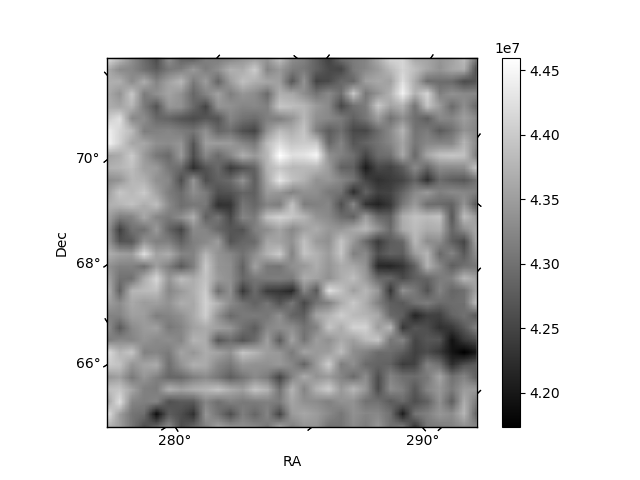
Histogram calculated using DETX and DETY for each event in the final _common_clean file
| Quadrant A |  |
 |
Quadrant B |
|---|---|---|---|
| Quadrant D |  |
 |
Quadrant C |
| Plot type | Count rate plots | Images |
|---|---|---|
| Comparison with Poisson distribution Blue bars denote a histogram of data divided into 1 sec bins. Red curve is a Poisson curve with rate = median count rate of data. |
 |
 |
| Quadrant-wise count rates Data is divided into 100 sec bins |
 |
|
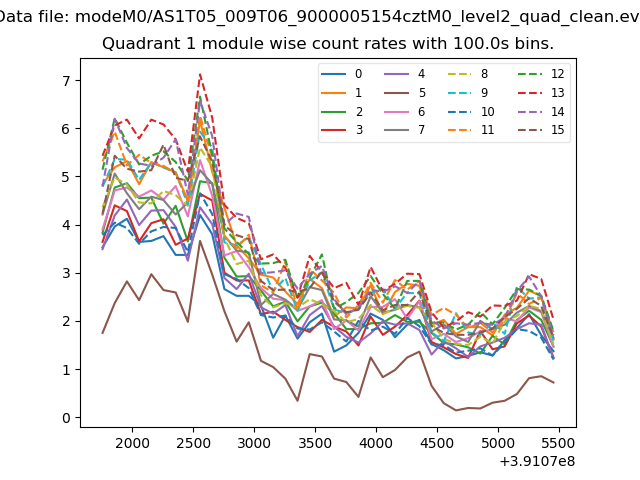
| Module-wise count rates for Quadrant A Data is divided into 100 sec bins |
 |
 |
| Module-wise count rates for Quadrant B Data is divided into 100 sec bins |
 |
 |
| Module-wise count rates for Quadrant C Data is divided into 100 sec bins |
 |
 |
| Module-wise count rates for Quadrant D Data is divided into 100 sec bins |
 |
 |
| Parameter | Plot |
|---|---|
| CZT HV Monitor |  |
| D_VDD |  |
| Temperature 1 |  |
| Veto HV Monitor |  |
| Veto LLD |  |
| Alpha Counter |  |
| _CPM_Rate |  |
| CZT Counter |  |
| +2.5 Volts monitor |  |
| +5 Volts monitor |  |
| _ROLL_ROT |  |
| _Roll_DEC |  |
| _Roll_RA |  |
| Veto Counter |  |