| Param | Original file | Final file |
|---|---|---|
| Filename | modeM0/AS1A10_071T50_9000005166cztM0_level2.fits | modeM0/AS1A10_071T50_9000005166cztM0_level2_quad_clean.evt |
| Size (bytes) | 425,589,120 | 433,396,800 |
| Size | 405.9 MB | 413.3 MB |
| Events in quadrant A | 2,640,966 | 2,790,296 |
| Events in quadrant B | 2,502,406 | 2,722,025 |
| Events in quadrant C | 2,464,840 | 2,492,823 |
| Events in quadrant D | 2,029,400 | 1,874,168 |
| Mode M0 | |||
|---|---|---|---|
| Quadrant | BADHDUFLAG | Total packets | Discarded packets |
| A | 0 | 97575 | 0 |
| B | 0 | 114687 | 0 |
| C | 0 | 142623 | 0 |
| D | 0 | 166508 | 0 |
| Mode M9 | |||
|---|---|---|---|
| Quadrant | BADHDUFLAG | Total packets | Discarded packets |
| A | 0 | 181 | 0 |
| B | 0 | 181 | 0 |
| C | 0 | 181 | 0 |
| D | 0 | 181 | 0 |
| Mode SS | |||
|---|---|---|---|
| Quadrant | BADHDUFLAG | Total packets | Discarded packets |
| A | 0 | 968 | 0 |
| B | 0 | 968 | 0 |
| C | 0 | 968 | 0 |
| D | 0 | 968 | 0 |
| Quadrant | Total seconds | Saturated seconds | Saturation percentage |
|---|---|---|---|
| A | 47287 | 81 | 0.171294% |
| B | 47287 | 1179 | 2.493286% |
| C | 47287 | 4107 | 8.685262% |
| D | 47287 | 8475 | 17.922473% |
Noise dominated data is calculated using 1-second bins in cleaned event files. If a bin has >2000 counts, and if more than 50% of those come from <1% of pixels, then it is considered to be noise-dominated and hence unusable.
| Quadrant | # 1 sec bins | Bins with >0 counts | Bins with >2000 counts | High rate bins dominated by noise | Noise dominated (total time) | Noise dominated (detector-on time) | Marked lightcurve |
|---|---|---|---|---|---|---|---|
| A | 65449 | 47288 | 0 | 0 | 0.00% | 0.00% |  |
| B | 65449 | 47276 | 0 | 0 | 0.00% | 0.00% | 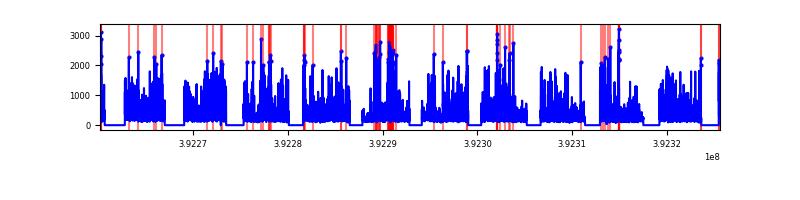 |
| C | 65449 | 47240 | 0 | 0 | 0.00% | 0.00% |  |
| D | 65449 | 47149 | 0 | 0 | 0.00% | 0.00% |  |
Top three noisy pixels from each quadrant. If the there are fewer than three noisy pixels in the level2.evt file, extra rows are filled as -1
| Pixel properties | Quadrant properties | ||||||
|---|---|---|---|---|---|---|---|
| Quadrant | DetID | PixID | Counts | Sigma | Mean | Median | Sigma |
| A | 7 | 110 | 2235 | 9.17 | 689 | 645 | 173.3 |
| A | 0 | 29 | 2180 | 8.85 | 689 | 645 | 173.3 |
| A | 9 | 19 | 2096 | 8.37 | 689 | 645 | 173.3 |
| B | 2 | 9 | 2160 | 11.59 | 662 | 630 | 132.0 |
| B | 3 | 80 | 1932 | 9.86 | 662 | 630 | 132.0 |
| B | 2 | 8 | 1779 | 8.7 | 662 | 630 | 132.0 |
| C | 1 | 81 | 2057 | 8.7 | 650 | 608 | 166.6 |
| C | 1 | 80 | 2004 | 8.38 | 650 | 608 | 166.6 |
| C | 3 | 202 | 1926 | 7.91 | 650 | 608 | 166.6 |
| D | 4 | 160 | 1517 | 6.34 | 580 | 527 | 156.1 |
| D | 10 | 113 | 1514 | 6.32 | 580 | 527 | 156.1 |
| D | 7 | 3 | 1469 | 6.04 | 580 | 527 | 156.1 |
Histogram calculated using DETX and DETY for each event in the final _common_clean file
| Quadrant A |  |
 |
Quadrant B |
|---|---|---|---|
| Quadrant D |  |
 |
Quadrant C |
| Plot type | Count rate plots | Images |
|---|---|---|
| Comparison with Poisson distribution Blue bars denote a histogram of data divided into 1 sec bins. Red curve is a Poisson curve with rate = median count rate of data. |
 |
 |
| Quadrant-wise count rates Data is divided into 100 sec bins |
 |
|
| Module-wise count rates for Quadrant A Data is divided into 100 sec bins |
 |
 |
| Module-wise count rates for Quadrant B Data is divided into 100 sec bins |
 |
 |
| Module-wise count rates for Quadrant C Data is divided into 100 sec bins |
 |
 |
| Module-wise count rates for Quadrant D Data is divided into 100 sec bins |
 |
 |
| Parameter | Plot |
|---|---|
| CZT HV Monitor |  |
| D_VDD | 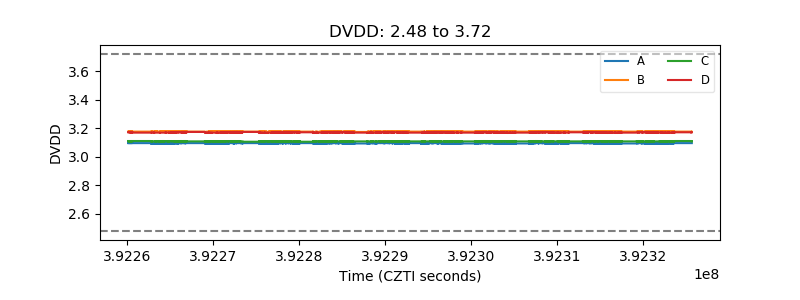 |
| Temperature 1 |  |
| Veto HV Monitor |  |
| Veto LLD |  |
| Alpha Counter |  |
| _CPM_Rate |  |
| CZT Counter |  |
| +2.5 Volts monitor |  |
| +5 Volts monitor |  |
| _ROLL_ROT |  |
| _Roll_DEC |  |
| _Roll_RA |  |
| Veto Counter |  |