| Param | Original file | Final file |
|---|---|---|
| Filename | modeM0/AS1T04_084T01_9000005198cztM0_level2.fits | modeM0/AS1T04_084T01_9000005198cztM0_level2_quad_clean.evt |
| Size (bytes) | 1,292,492,160 | 1,263,994,560 |
| Size | 1.2 GB | 1.2 GB |
| Events in quadrant A | 8,020,408 | 7,780,788 |
| Events in quadrant B | 7,440,296 | 7,407,802 |
| Events in quadrant C | 7,780,892 | 7,326,907 |
| Events in quadrant D | 6,661,748 | 6,529,863 |
| Mode M0 | |||
|---|---|---|---|
| Quadrant | BADHDUFLAG | Total packets | Discarded packets |
| A | 0 | 290221 | 0 |
| B | 0 | 381251 | 0 |
| C | 0 | 286949 | 0 |
| D | 0 | 365289 | 0 |
| Mode SS | |||
|---|---|---|---|
| Quadrant | BADHDUFLAG | Total packets | Discarded packets |
| A | 0 | 2754 | 0 |
| B | 0 | 2754 | 0 |
| C | 0 | 2754 | 0 |
| D | 0 | 2754 | 0 |
| Mode M9 | |||
|---|---|---|---|
| Quadrant | BADHDUFLAG | Total packets | Discarded packets |
| A | 0 | 526 | 0 |
| B | 0 | 526 | 0 |
| C | 0 | 526 | 0 |
| D | 0 | 526 | 0 |
| Quadrant | Total seconds | Saturated seconds | Saturation percentage |
|---|---|---|---|
| A | 134785 | 917 | 0.680343% |
| B | 134785 | 8486 | 6.295953% |
| C | 134785 | 1158 | 0.859146% |
| D | 134785 | 6974 | 5.174166% |
Noise dominated data is calculated using 1-second bins in cleaned event files. If a bin has >2000 counts, and if more than 50% of those come from <1% of pixels, then it is considered to be noise-dominated and hence unusable.
| Quadrant | # 1 sec bins | Bins with >0 counts | Bins with >2000 counts | High rate bins dominated by noise | Noise dominated (total time) | Noise dominated (detector-on time) | Marked lightcurve |
|---|---|---|---|---|---|---|---|
| A | 187302 | 134785 | 0 | 0 | 0.00% | 0.00% |  |
| B | 187301 | 134704 | 0 | 0 | 0.00% | 0.00% |  |
| C | 187302 | 134778 | 0 | 0 | 0.00% | 0.00% |  |
| D | 187302 | 134710 | 0 | 0 | 0.00% | 0.00% |  |
Top three noisy pixels from each quadrant. If the there are fewer than three noisy pixels in the level2.evt file, extra rows are filled as -1
| Pixel properties | Quadrant properties | ||||||
|---|---|---|---|---|---|---|---|
| Quadrant | DetID | PixID | Counts | Sigma | Mean | Median | Sigma |
| A | 9 | 19 | 6558 | 9.04 | 2094 | 1969 | 507.8 |
| A | 7 | 110 | 6431 | 8.79 | 2094 | 1969 | 507.8 |
| A | 0 | 29 | 6283 | 8.49 | 2094 | 1969 | 507.8 |
| B | 2 | 9 | 6262 | 11.5 | 1967 | 1882 | 381.0 |
| B | 3 | 80 | 5725 | 10.09 | 1967 | 1882 | 381.0 |
| B | 2 | 8 | 5154 | 8.59 | 1967 | 1882 | 381.0 |
| C | 1 | 81 | 6367 | 8.44 | 2056 | 1927 | 526.2 |
| C | 1 | 80 | 6172 | 8.07 | 2056 | 1927 | 526.2 |
| C | 3 | 202 | 6047 | 7.83 | 2056 | 1927 | 526.2 |
| D | 4 | 160 | 4878 | 6.19 | 1911 | 1743 | 506.0 |
| D | 10 | 189 | 4849 | 6.14 | 1911 | 1743 | 506.0 |
| D | 10 | 113 | 4835 | 6.11 | 1911 | 1743 | 506.0 |
Histogram calculated using DETX and DETY for each event in the final _common_clean file
| Quadrant A |  |
 |
Quadrant B |
|---|---|---|---|
| Quadrant D |  |
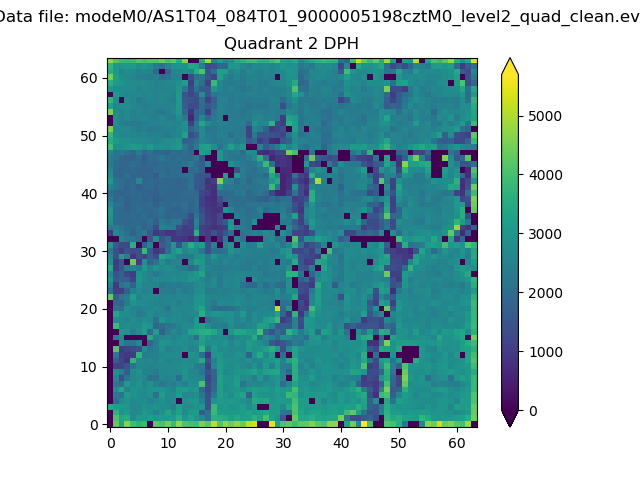 |
Quadrant C |
| Plot type | Count rate plots | Images |
|---|---|---|
| Comparison with Poisson distribution Blue bars denote a histogram of data divided into 1 sec bins. Red curve is a Poisson curve with rate = median count rate of data. |
 |
 |
| Quadrant-wise count rates Data is divided into 100 sec bins |
 |
|
| Module-wise count rates for Quadrant A Data is divided into 100 sec bins |
 |
 |
| Module-wise count rates for Quadrant B Data is divided into 100 sec bins |
 |
 |
| Module-wise count rates for Quadrant C Data is divided into 100 sec bins |
 |
 |
| Module-wise count rates for Quadrant D Data is divided into 100 sec bins |
 |
 |
| Parameter | Plot |
|---|---|
| CZT HV Monitor |  |
| D_VDD |  |
| Temperature 1 |  |
| Veto HV Monitor |  |
| Veto LLD |  |
| Alpha Counter |  |
| _CPM_Rate |  |
| CZT Counter |  |
| +2.5 Volts monitor |  |
| +5 Volts monitor |  |
| _ROLL_ROT |  |
| _Roll_DEC |  |
| _Roll_RA |  |
| Veto Counter |  |