| Param | Original file | Final file |
|---|---|---|
| Filename | modeM0/AS1C07_001T12_9000005352cztM0_level2.fits | modeM0/AS1C07_001T12_9000005352cztM0_level2_quad_clean.evt |
| Size (bytes) | 2,517,825,600 | 3,035,280,960 |
| Size | 2.3 GB | 2.8 GB |
| Events in quadrant A | 15,433,570 | 19,696,416 |
| Events in quadrant B | 14,591,882 | 19,318,761 |
| Events in quadrant C | 14,854,324 | 18,391,158 |
| Events in quadrant D | 12,397,774 | 15,563,127 |
| Mode M9 | |||
|---|---|---|---|
| Quadrant | BADHDUFLAG | Total packets | Discarded packets |
| A | 0 | 1014 | 0 |
| B | 0 | 1014 | 0 |
| C | 0 | 1014 | 0 |
| D | 0 | 1014 | 0 |
| Mode M0 | |||
|---|---|---|---|
| Quadrant | BADHDUFLAG | Total packets | Discarded packets |
| A | 0 | 593662 | 0 |
| B | 0 | 637082 | 0 |
| C | 0 | 584994 | 0 |
| D | 0 | 861834 | 0 |
| Mode SS | |||
|---|---|---|---|
| Quadrant | BADHDUFLAG | Total packets | Discarded packets |
| A | 0 | 5663 | 0 |
| B | 0 | 5664 | 0 |
| C | 0 | 5664 | 0 |
| D | 0 | 5664 | 0 |
| Quadrant | Total seconds | Saturated seconds | Saturation percentage |
|---|---|---|---|
| A | 276868 | 1444 | 0.521548% |
| B | 276868 | 5839 | 2.108947% |
| C | 276867 | 1550 | 0.559836% |
| D | 276868 | 25728 | 9.292515% |
Noise dominated data is calculated using 1-second bins in cleaned event files. If a bin has >2000 counts, and if more than 50% of those come from <1% of pixels, then it is considered to be noise-dominated and hence unusable.
| Quadrant | # 1 sec bins | Bins with >0 counts | Bins with >2000 counts | High rate bins dominated by noise | Noise dominated (total time) | Noise dominated (detector-on time) | Marked lightcurve |
|---|---|---|---|---|---|---|---|
| A | 389329 | 276800 | 0 | 0 | 0.00% | 0.00% |  |
| B | 389329 | 276797 | 0 | 0 | 0.00% | 0.00% |  |
| C | 389329 | 276843 | 0 | 0 | 0.00% | 0.00% |  |
| D | 389329 | 276027 | 0 | 0 | 0.00% | 0.00% | 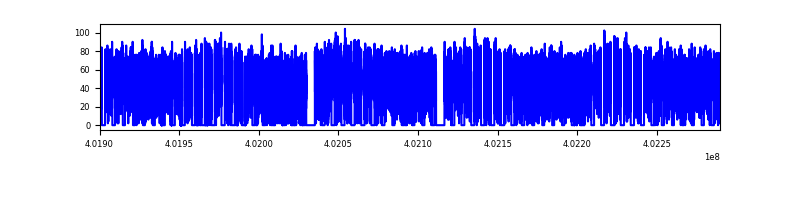 |
Top three noisy pixels from each quadrant. If the there are fewer than three noisy pixels in the level2.evt file, extra rows are filled as -1
| Pixel properties | Quadrant properties | ||||||
|---|---|---|---|---|---|---|---|
| Quadrant | DetID | PixID | Counts | Sigma | Mean | Median | Sigma |
| A | 9 | 19 | 12688 | 9.05 | 4042 | 3813 | 980.5 |
| A | 7 | 110 | 12593 | 8.95 | 4042 | 3813 | 980.5 |
| A | 0 | 29 | 12551 | 8.91 | 4042 | 3813 | 980.5 |
| B | 2 | 9 | 12596 | 11.94 | 3869 | 3715 | 743.7 |
| B | 3 | 80 | 11478 | 10.44 | 3869 | 3715 | 743.7 |
| B | 2 | 8 | 10310 | 8.87 | 3869 | 3715 | 743.7 |
| C | 1 | 81 | 12491 | 8.85 | 3931 | 3701 | 992.9 |
| C | 1 | 80 | 11960 | 8.32 | 3931 | 3701 | 992.9 |
| C | 3 | 203 | 11836 | 8.19 | 3931 | 3701 | 992.9 |
| D | 4 | 160 | 9204 | 6.29 | 3557 | 3235 | 949.3 |
| D | 7 | 3 | 9126 | 6.2 | 3557 | 3235 | 949.3 |
| D | 10 | 189 | 8929 | 6.0 | 3557 | 3235 | 949.3 |
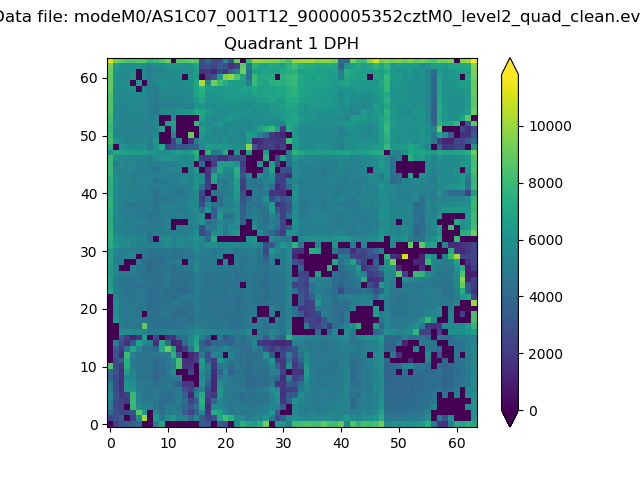
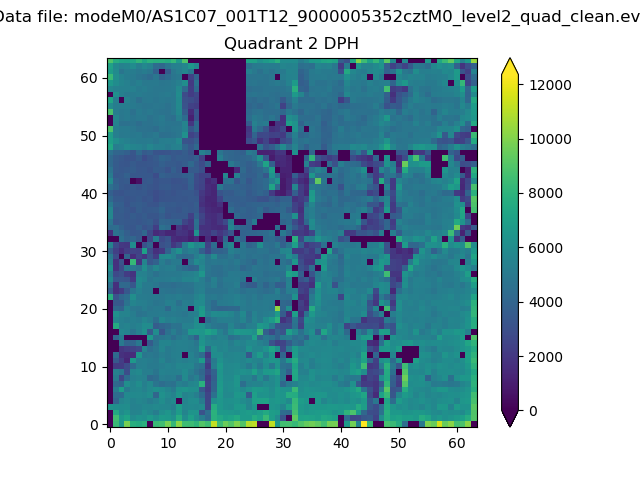
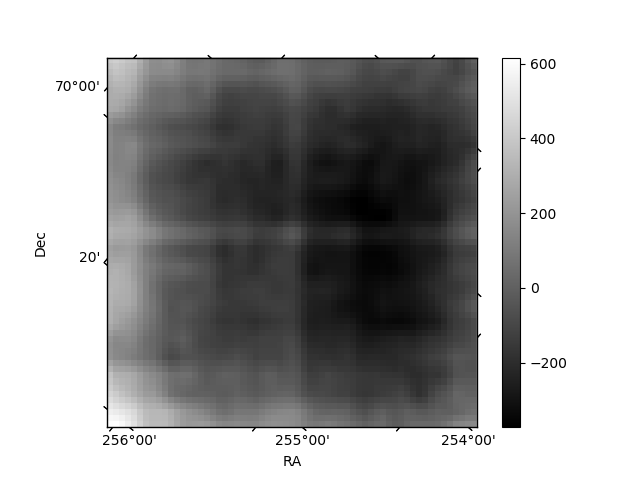
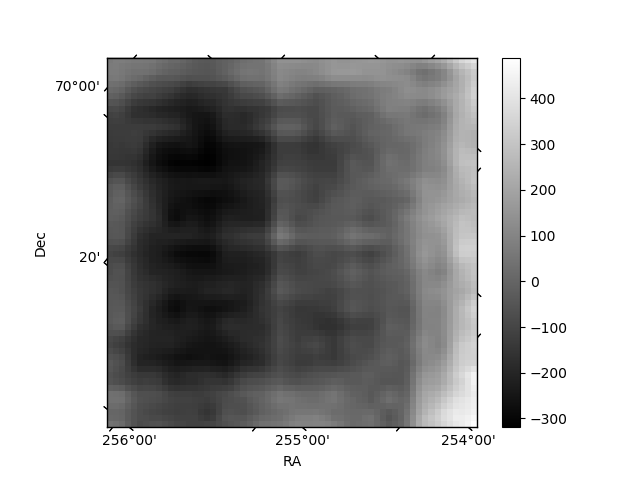
Histogram calculated using DETX and DETY for each event in the final _common_clean file
| Quadrant A |  |
 |
Quadrant B |
|---|---|---|---|
| Quadrant D |  |
 |
Quadrant C |
| Plot type | Count rate plots | Images |
|---|---|---|
| Comparison with Poisson distribution Blue bars denote a histogram of data divided into 1 sec bins. Red curve is a Poisson curve with rate = median count rate of data. |
 |
 |
| Quadrant-wise count rates Data is divided into 100 sec bins |
 |
|
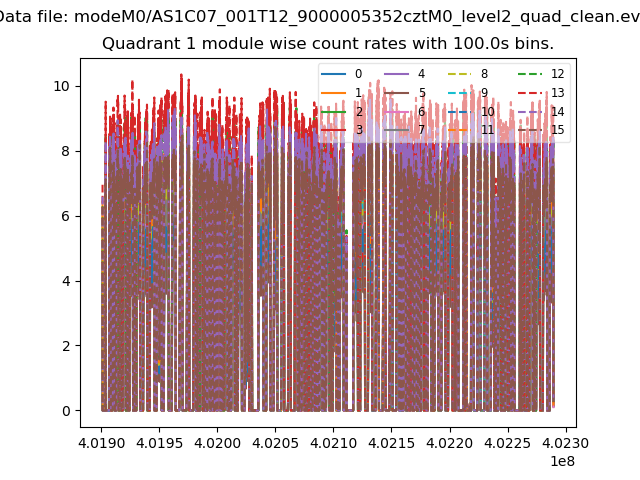
| Module-wise count rates for Quadrant A Data is divided into 100 sec bins |
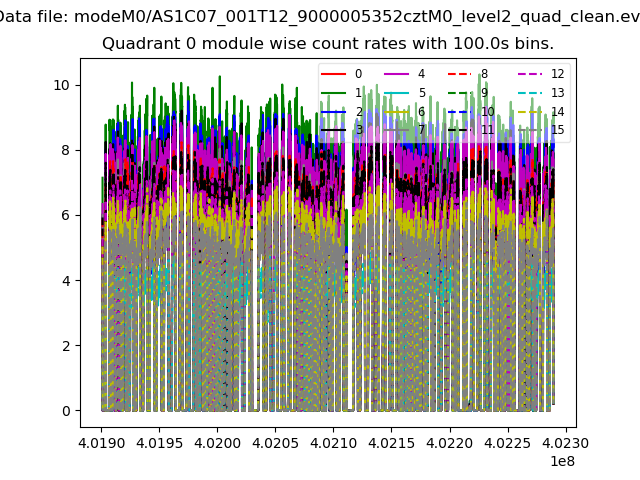 |
 |
| Module-wise count rates for Quadrant B Data is divided into 100 sec bins |
 |
 |
| Module-wise count rates for Quadrant C Data is divided into 100 sec bins |
 |
 |
| Module-wise count rates for Quadrant D Data is divided into 100 sec bins |
 |
 |
| Parameter | Plot |
|---|---|
| CZT HV Monitor | 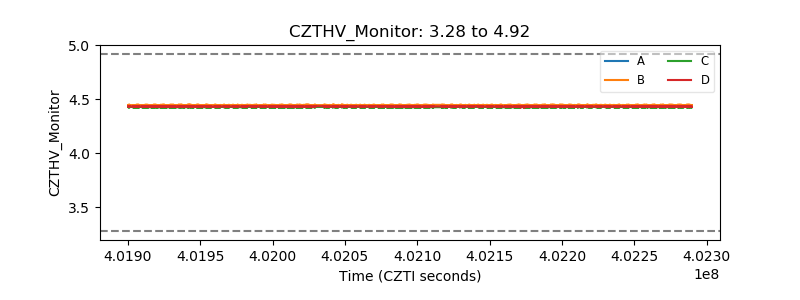 |
| D_VDD | 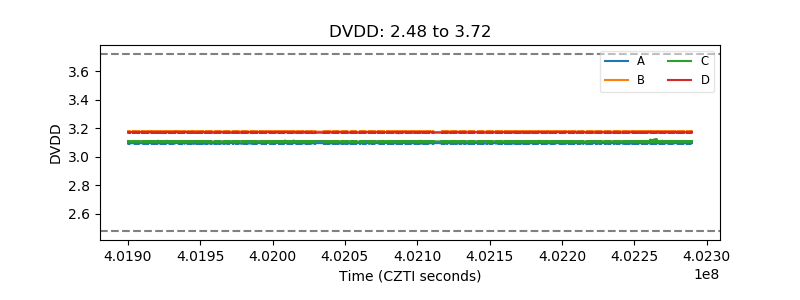 |
| Temperature 1 |  |
| Veto HV Monitor |  |
| Veto LLD | 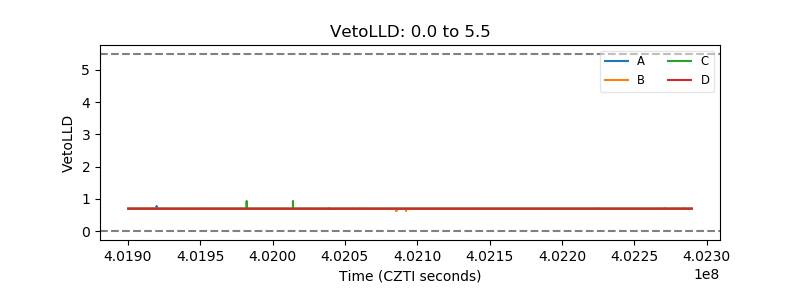 |
| Alpha Counter | 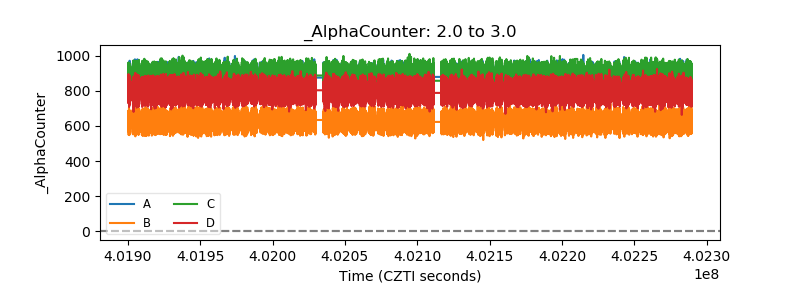 |
| _CPM_Rate | 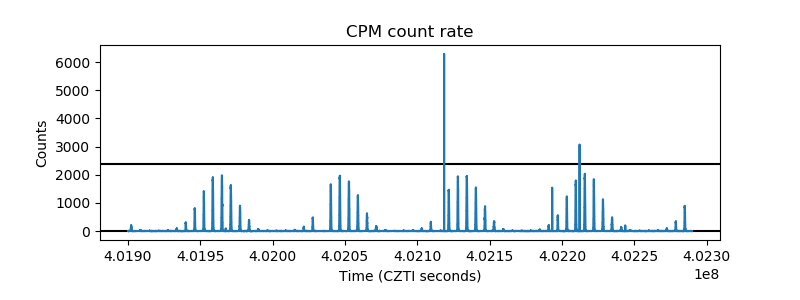 |
| CZT Counter |  |
| +2.5 Volts monitor |  |
| +5 Volts monitor |  |
| _ROLL_ROT |  |
| _Roll_DEC |  |
| _Roll_RA |  |
| Veto Counter | 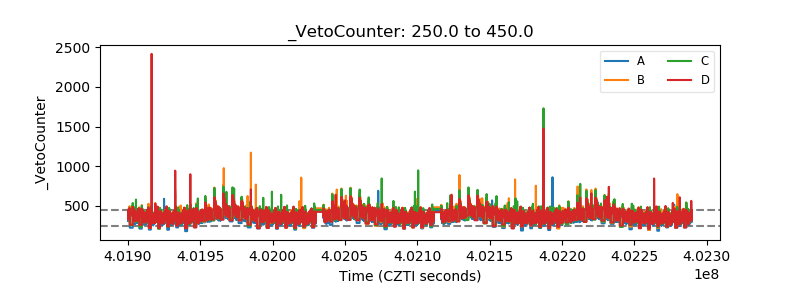 |