| Param | Original file | Final file |
|---|---|---|
| Filename | modeM0/AS1A11_082T01_9000005356cztM0_level2.fits | modeM0/AS1A11_082T01_9000005356cztM0_level2_quad_clean.evt |
| Size (bytes) | 89,611,200 | 125,965,440 |
| Size | 85.5 MB | 120.1 MB |
| Events in quadrant A | 552,256 | 831,557 |
| Events in quadrant B | 524,766 | 831,426 |
| Events in quadrant C | 545,096 | 830,743 |
| Events in quadrant D | 450,578 | 679,644 |
| Mode M0 | |||
|---|---|---|---|
| Quadrant | BADHDUFLAG | Total packets | Discarded packets |
| A | 0 | 20470 | 0 |
| B | 0 | 22471 | 0 |
| C | 0 | 20170 | 0 |
| D | 0 | 31117 | 0 |
| Mode SS | |||
|---|---|---|---|
| Quadrant | BADHDUFLAG | Total packets | Discarded packets |
| A | 0 | 188 | 0 |
| B | 0 | 188 | 0 |
| C | 0 | 188 | 0 |
| D | 0 | 188 | 0 |
| Mode M9 | |||
|---|---|---|---|
| Quadrant | BADHDUFLAG | Total packets | Discarded packets |
| A | 0 | 47 | 0 |
| B | 0 | 47 | 0 |
| C | 0 | 47 | 0 |
| D | 0 | 48 | 0 |
| Quadrant | Total seconds | Saturated seconds | Saturation percentage |
|---|---|---|---|
| A | 9246 | 31 | 0.335280% |
| B | 9246 | 249 | 2.693056% |
| C | 9246 | 110 | 1.189704% |
| D | 9246 | 919 | 9.939433% |
Noise dominated data is calculated using 1-second bins in cleaned event files. If a bin has >2000 counts, and if more than 50% of those come from <1% of pixels, then it is considered to be noise-dominated and hence unusable.
| Quadrant | # 1 sec bins | Bins with >0 counts | Bins with >2000 counts | High rate bins dominated by noise | Noise dominated (total time) | Noise dominated (detector-on time) | Marked lightcurve |
|---|---|---|---|---|---|---|---|
| A | 13341 | 9245 | 0 | 0 | 0.00% | 0.00% |  |
| B | 13341 | 9243 | 0 | 0 | 0.00% | 0.00% | 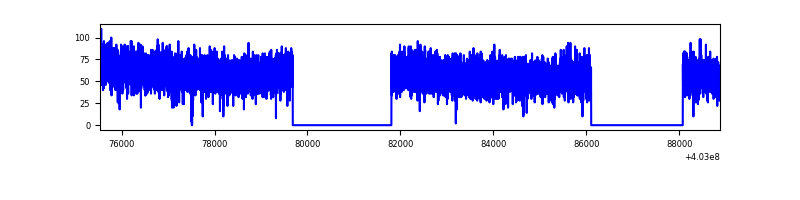 |
| C | 13341 | 9245 | 0 | 0 | 0.00% | 0.00% |  |
| D | 13341 | 9235 | 0 | 0 | 0.00% | 0.00% | 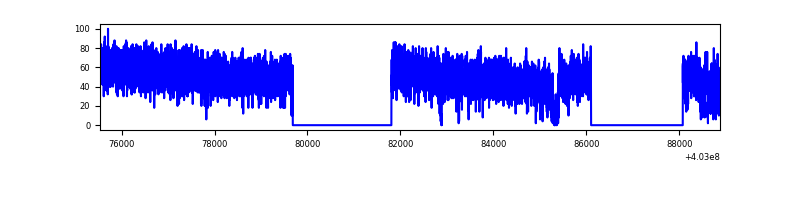 |
Top three noisy pixels from each quadrant. If the there are fewer than three noisy pixels in the level2.evt file, extra rows are filled as -1
| Pixel properties | Quadrant properties | ||||||
|---|---|---|---|---|---|---|---|
| Quadrant | DetID | PixID | Counts | Sigma | Mean | Median | Sigma |
| A | 9 | 19 | 473 | 9.32 | 144 | 137 | 36.1 |
| A | 7 | 110 | 455 | 8.82 | 144 | 137 | 36.1 |
| A | 14 | 95 | 442 | 8.46 | 144 | 137 | 36.1 |
| B | 3 | 80 | 432 | 10.21 | 139 | 133 | 29.3 |
| B | 2 | 9 | 411 | 9.49 | 139 | 133 | 29.3 |
| B | 3 | 17 | 368 | 8.02 | 139 | 133 | 29.3 |
| C | 1 | 81 | 447 | 8.07 | 144 | 137 | 38.4 |
| C | 3 | 202 | 432 | 7.68 | 144 | 137 | 38.4 |
| C | 3 | 203 | 428 | 7.57 | 144 | 137 | 38.4 |
| D | 10 | 189 | 361 | 6.9 | 129 | 118 | 35.2 |
| D | 11 | 66 | 334 | 6.14 | 129 | 118 | 35.2 |
| D | 4 | 160 | 334 | 6.14 | 129 | 118 | 35.2 |
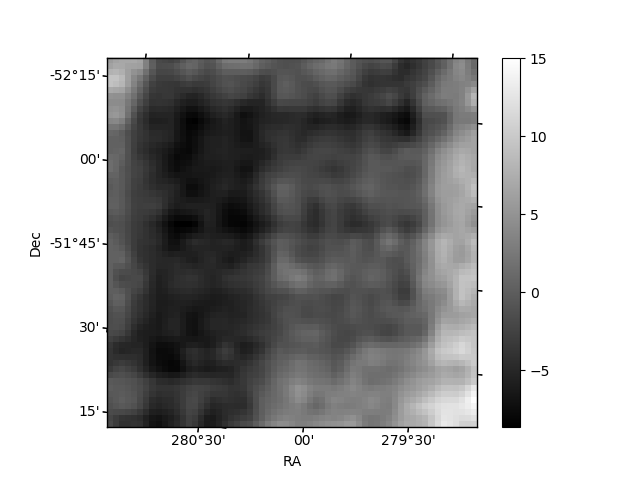
Histogram calculated using DETX and DETY for each event in the final _common_clean file
| Quadrant A | 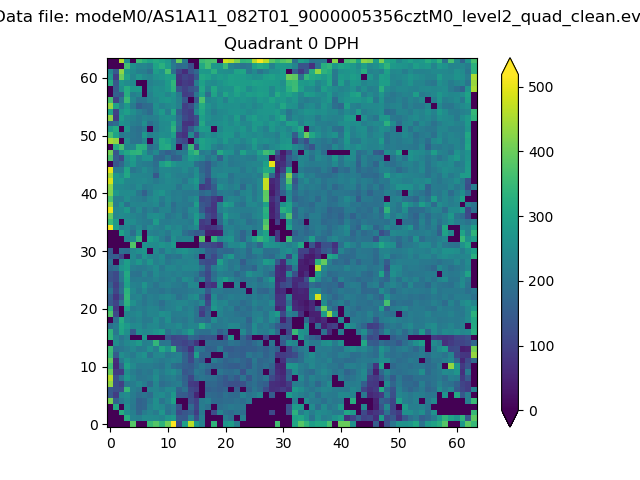 |
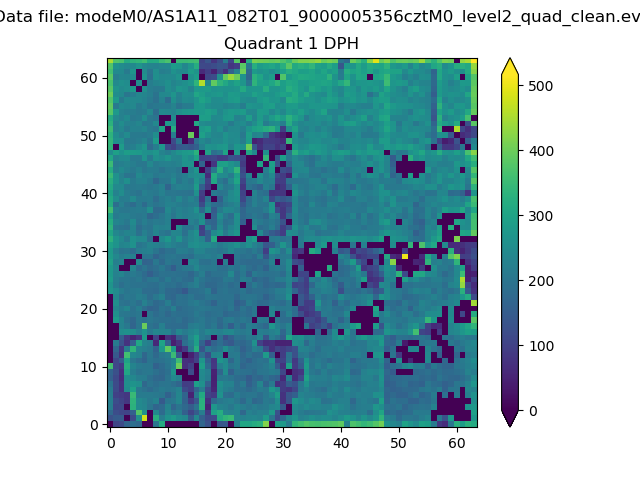 |
Quadrant B |
|---|---|---|---|
| Quadrant D | 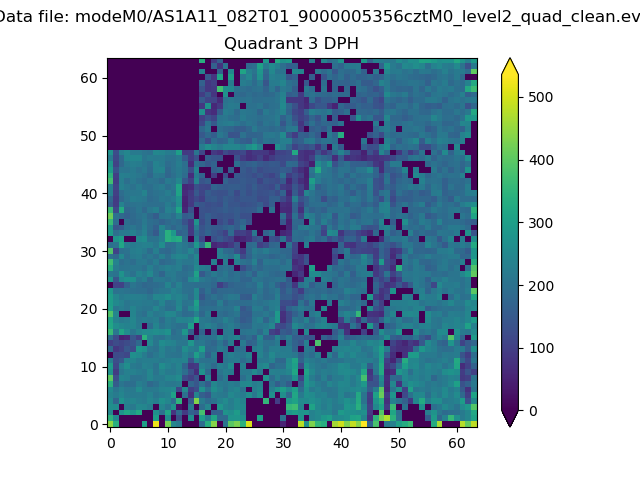 |
 |
Quadrant C |
| Plot type | Count rate plots | Images |
|---|---|---|
| Comparison with Poisson distribution Blue bars denote a histogram of data divided into 1 sec bins. Red curve is a Poisson curve with rate = median count rate of data. |
 |
 |
| Quadrant-wise count rates Data is divided into 100 sec bins |
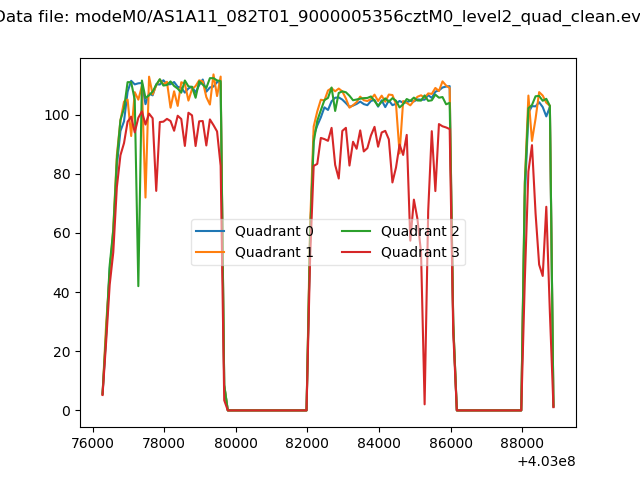 |
|
| Module-wise count rates for Quadrant A Data is divided into 100 sec bins |
 |
 |
| Module-wise count rates for Quadrant B Data is divided into 100 sec bins |
 |
 |
| Module-wise count rates for Quadrant C Data is divided into 100 sec bins |
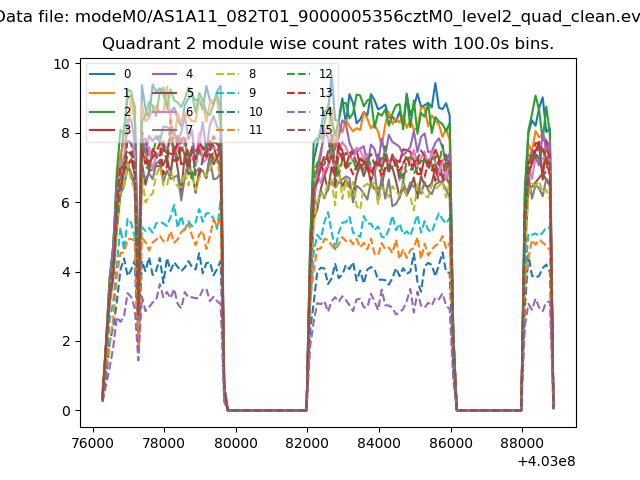 |
 |
| Module-wise count rates for Quadrant D Data is divided into 100 sec bins |
 |
 |
| Parameter | Plot |
|---|---|
| CZT HV Monitor |  |
| D_VDD |  |
| Temperature 1 |  |
| Veto HV Monitor |  |
| Veto LLD | 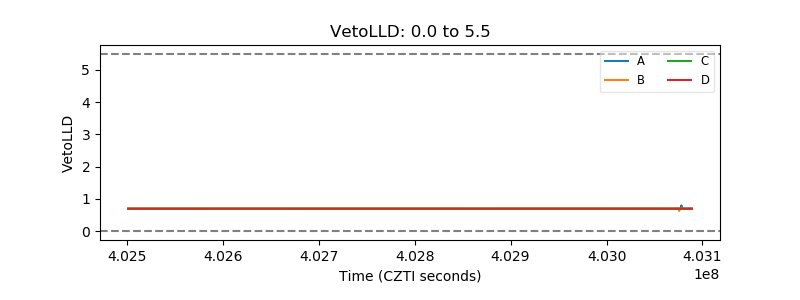 |
| Alpha Counter |  |
| _CPM_Rate |  |
| CZT Counter | 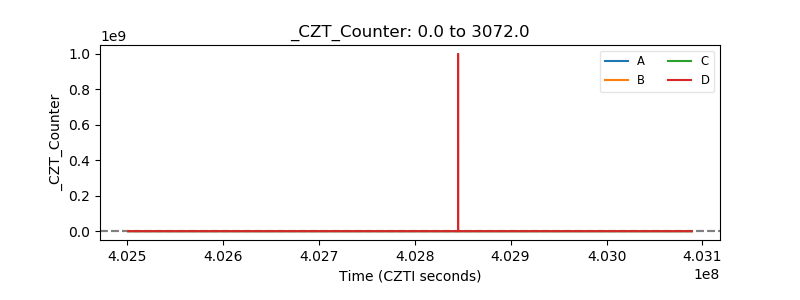 |
| +2.5 Volts monitor |  |
| +5 Volts monitor |  |
| _ROLL_ROT | 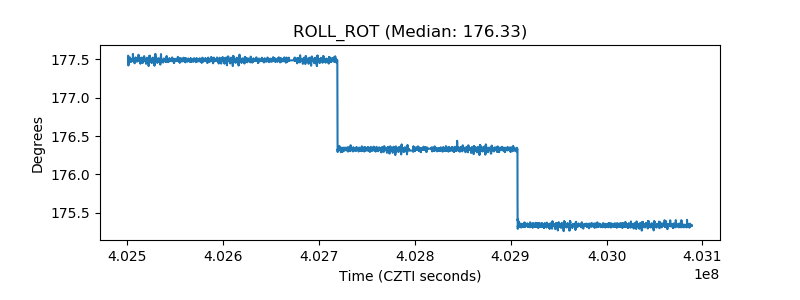 |
| _Roll_DEC |  |
| _Roll_RA |  |
| Veto Counter |  |