| Param | Original file | Final file |
|---|---|---|
| Filename | modeM0/AS1A11_024T01_9000005358cztM0_level2.fits | modeM0/AS1A11_024T01_9000005358cztM0_level2_quad_clean.evt |
| Size (bytes) | 617,022,720 | 669,240,000 |
| Size | 588.4 MB | 638.2 MB |
| Events in quadrant A | 3,755,642 | 4,138,011 |
| Events in quadrant B | 3,575,452 | 4,072,798 |
| Events in quadrant C | 3,718,812 | 4,035,026 |
| Events in quadrant D | 3,200,404 | 3,586,877 |
| Mode M9 | |||
|---|---|---|---|
| Quadrant | BADHDUFLAG | Total packets | Discarded packets |
| A | 0 | 245 | 0 |
| B | 0 | 245 | 0 |
| C | 0 | 245 | 0 |
| D | 0 | 246 | 0 |
| Mode SS | |||
|---|---|---|---|
| Quadrant | BADHDUFLAG | Total packets | Discarded packets |
| A | 0 | 1320 | 0 |
| B | 0 | 1320 | 0 |
| C | 0 | 1320 | 0 |
| D | 0 | 1320 | 0 |
| Mode M0 | |||
|---|---|---|---|
| Quadrant | BADHDUFLAG | Total packets | Discarded packets |
| A | 0 | 142923 | 0 |
| B | 0 | 154405 | 0 |
| C | 0 | 138997 | 0 |
| D | 0 | 161550 | 0 |
| Quadrant | Total seconds | Saturated seconds | Saturation percentage |
|---|---|---|---|
| A | 64688 | 200 | 0.309176% |
| B | 64688 | 1606 | 2.482686% |
| C | 64688 | 254 | 0.392654% |
| D | 64688 | 1524 | 2.355924% |
Noise dominated data is calculated using 1-second bins in cleaned event files. If a bin has >2000 counts, and if more than 50% of those come from <1% of pixels, then it is considered to be noise-dominated and hence unusable.
| Quadrant | # 1 sec bins | Bins with >0 counts | Bins with >2000 counts | High rate bins dominated by noise | Noise dominated (total time) | Noise dominated (detector-on time) | Marked lightcurve |
|---|---|---|---|---|---|---|---|
| A | 88645 | 64687 | 0 | 0 | 0.00% | 0.00% | 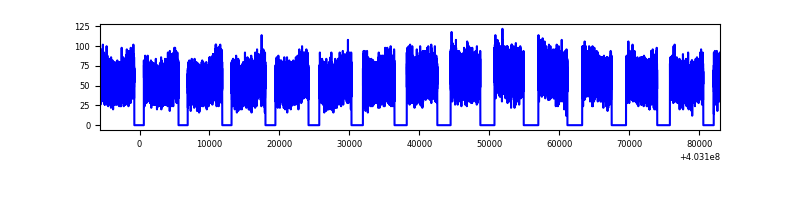 |
| B | 88645 | 64635 | 0 | 0 | 0.00% | 0.00% |  |
| C | 88645 | 64671 | 0 | 0 | 0.00% | 0.00% | 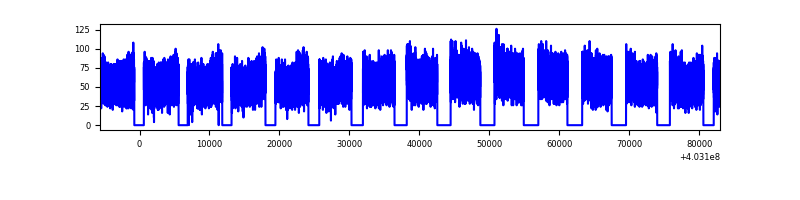 |
| D | 88645 | 64673 | 0 | 0 | 0.00% | 0.00% | 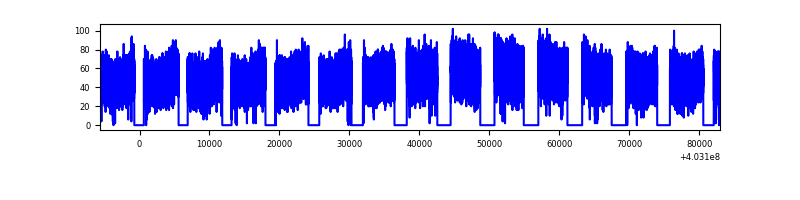 |
Top three noisy pixels from each quadrant. If the there are fewer than three noisy pixels in the level2.evt file, extra rows are filled as -1
| Pixel properties | Quadrant properties | ||||||
|---|---|---|---|---|---|---|---|
| Quadrant | DetID | PixID | Counts | Sigma | Mean | Median | Sigma |
| A | 7 | 110 | 3133 | 9.28 | 982 | 924 | 238.1 |
| A | 9 | 19 | 3131 | 9.27 | 982 | 924 | 238.1 |
| A | 0 | 29 | 3051 | 8.93 | 982 | 924 | 238.1 |
| B | 2 | 9 | 3062 | 11.71 | 947 | 904 | 184.3 |
| B | 3 | 80 | 2820 | 10.39 | 947 | 904 | 184.3 |
| B | 5 | 128 | 2564 | 9.01 | 947 | 904 | 184.3 |
| C | 1 | 81 | 3036 | 8.44 | 984 | 925 | 250.1 |
| C | 1 | 80 | 2943 | 8.07 | 984 | 925 | 250.1 |
| C | 3 | 187 | 2559 | 6.53 | 984 | 925 | 250.1 |
| D | 10 | 189 | 2364 | 6.28 | 915 | 836 | 243.1 |
| D | 7 | 3 | 2353 | 6.24 | 915 | 836 | 243.1 |
| D | 6 | 62 | 2287 | 5.97 | 915 | 836 | 243.1 |
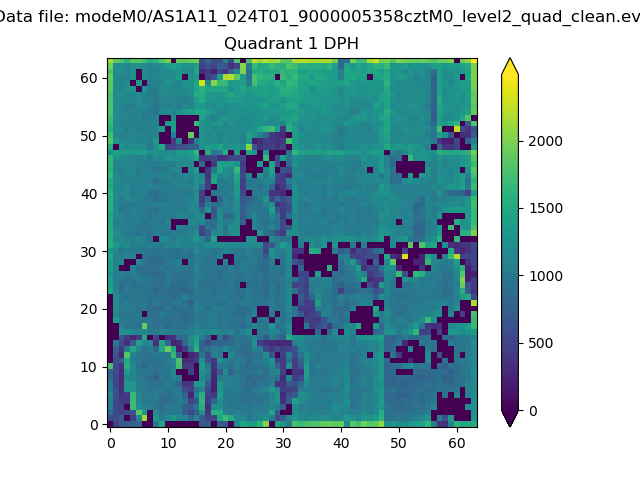
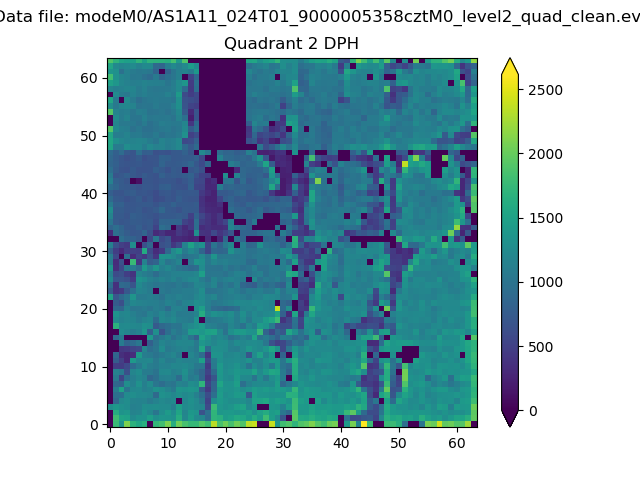
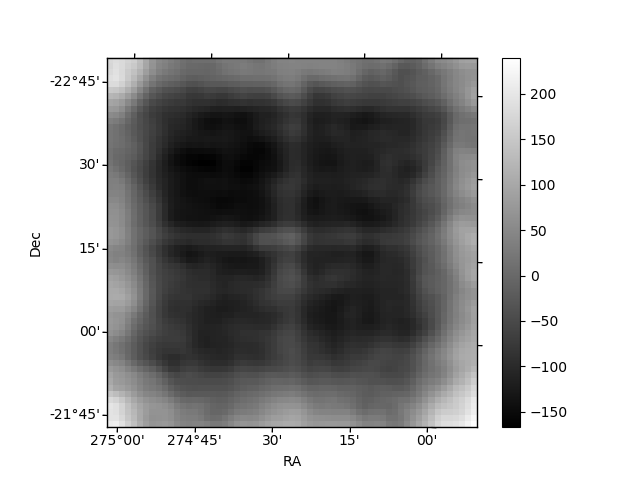
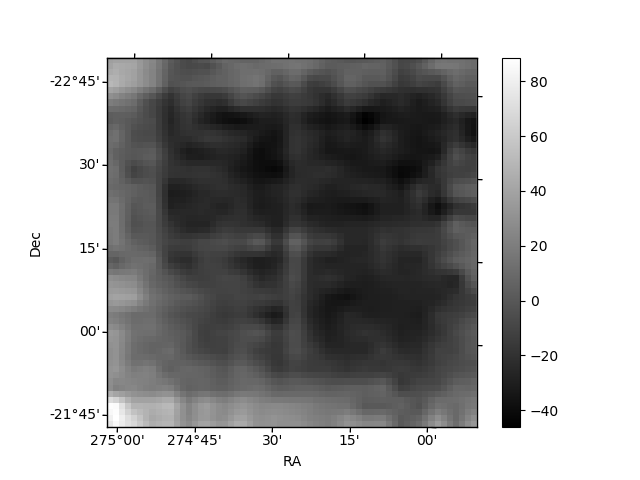
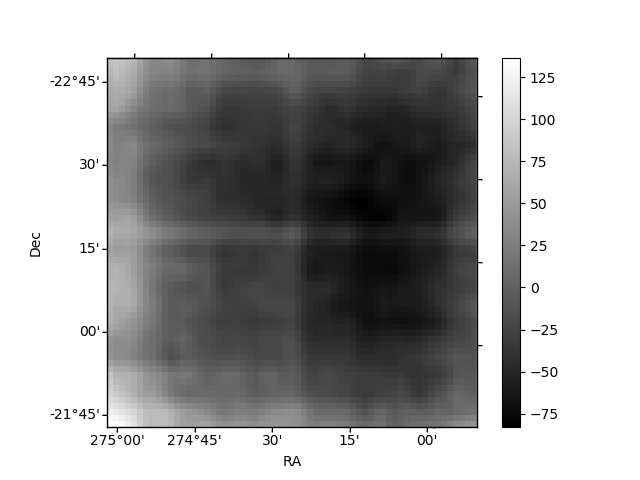
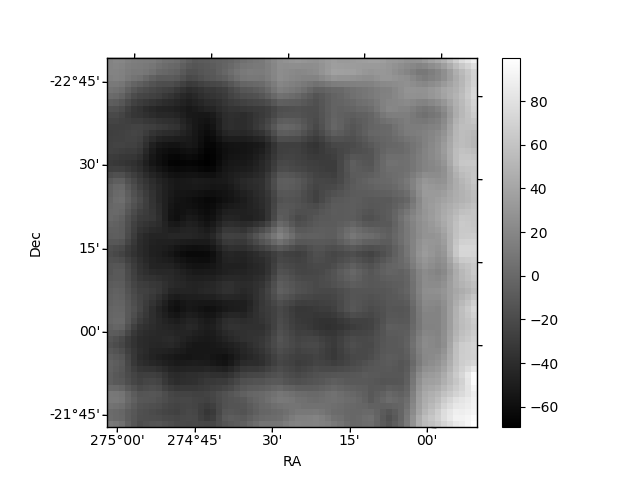
Histogram calculated using DETX and DETY for each event in the final _common_clean file
| Quadrant A | 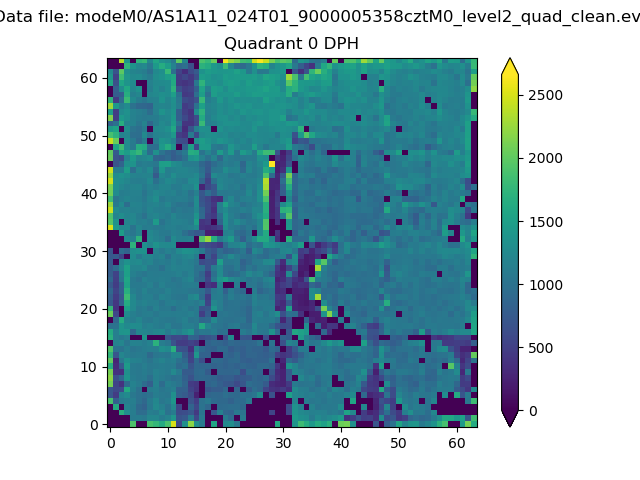 |
 |
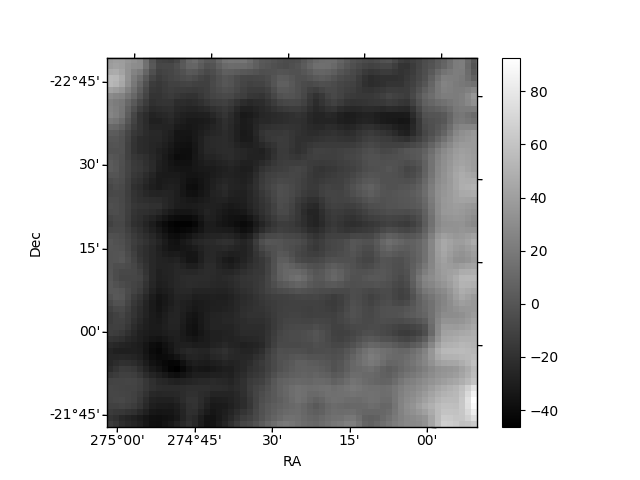
Quadrant B |
|---|---|---|---|
| Quadrant D | 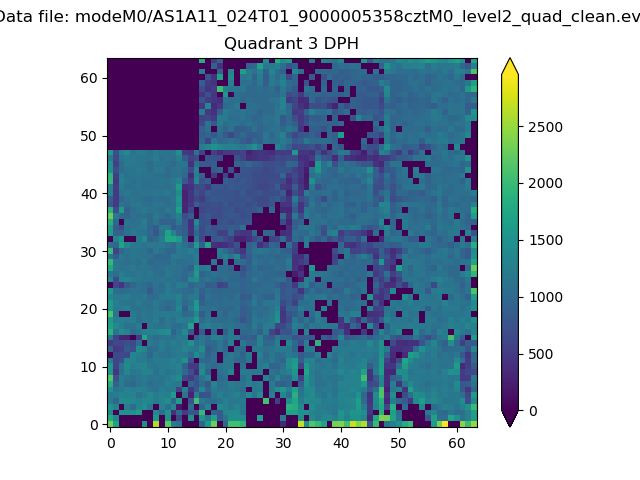 |
 |
Quadrant C |
| Plot type | Count rate plots | Images |
|---|---|---|
| Comparison with Poisson distribution Blue bars denote a histogram of data divided into 1 sec bins. Red curve is a Poisson curve with rate = median count rate of data. |
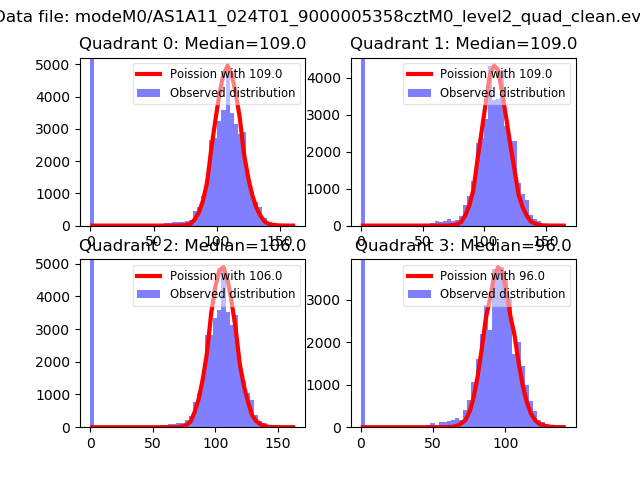 |
 |
| Quadrant-wise count rates Data is divided into 100 sec bins |
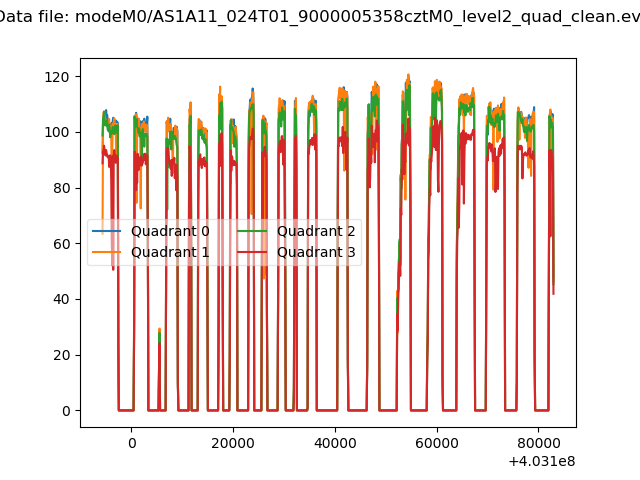 |
|
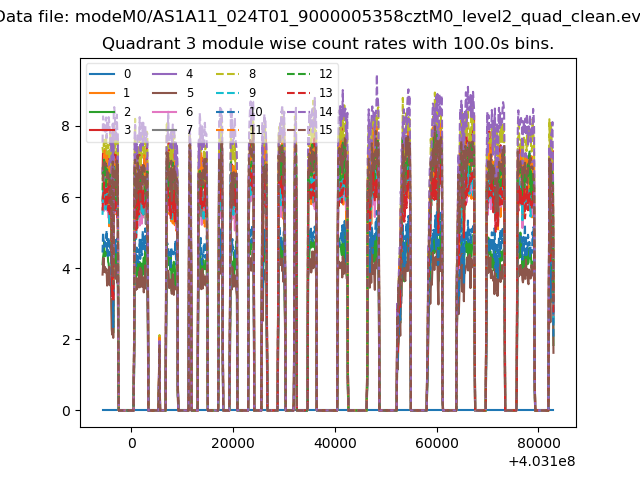
| Module-wise count rates for Quadrant A Data is divided into 100 sec bins |
 |
 |
| Module-wise count rates for Quadrant B Data is divided into 100 sec bins |
 |
 |
| Module-wise count rates for Quadrant C Data is divided into 100 sec bins |
 |
 |
| Module-wise count rates for Quadrant D Data is divided into 100 sec bins |
 |
 |
| Parameter | Plot |
|---|---|
| CZT HV Monitor | 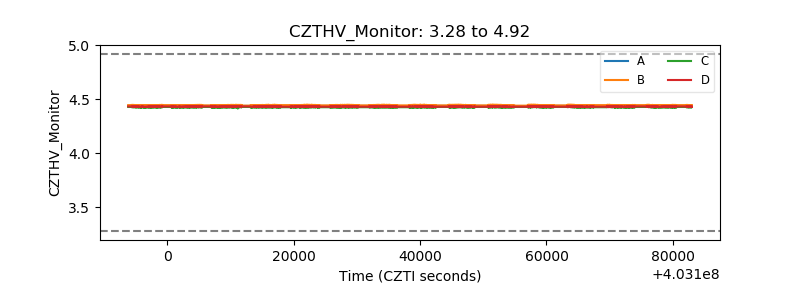 |
| D_VDD | 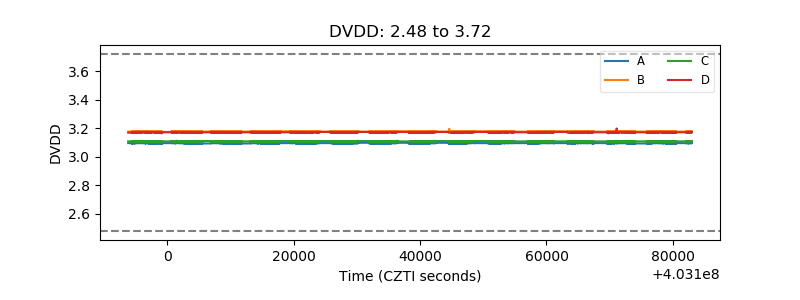 |
| Temperature 1 | 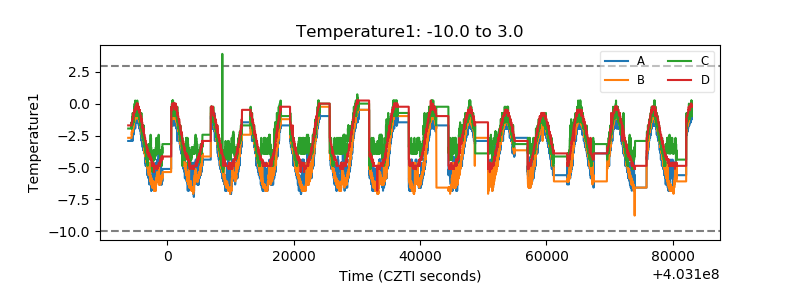 |
| Veto HV Monitor | 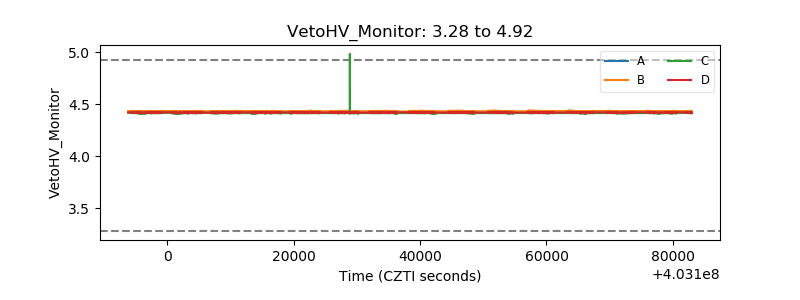 |
| Veto LLD | 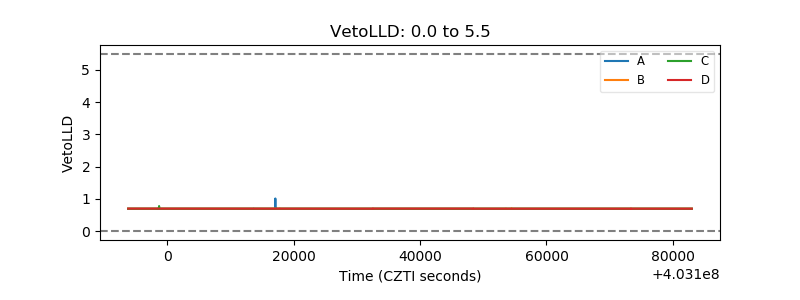 |
| Alpha Counter | 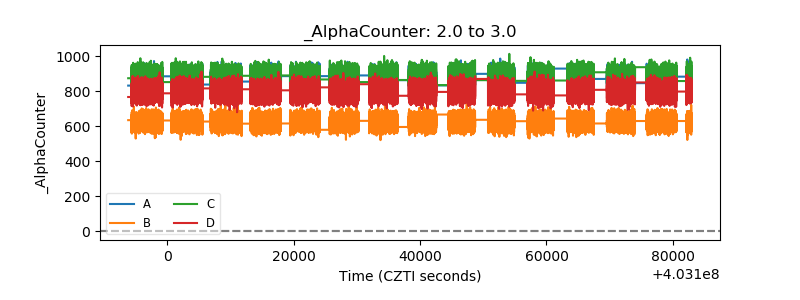 |
| _CPM_Rate | 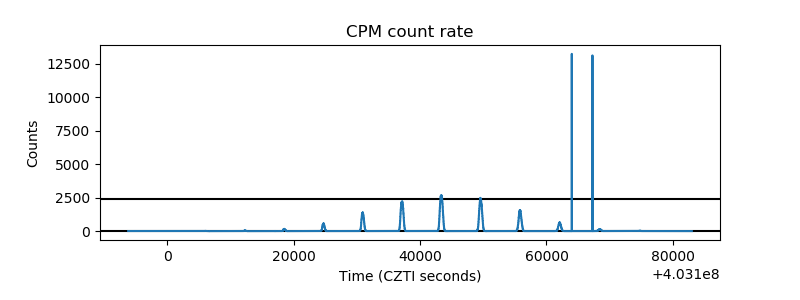 |
| CZT Counter | 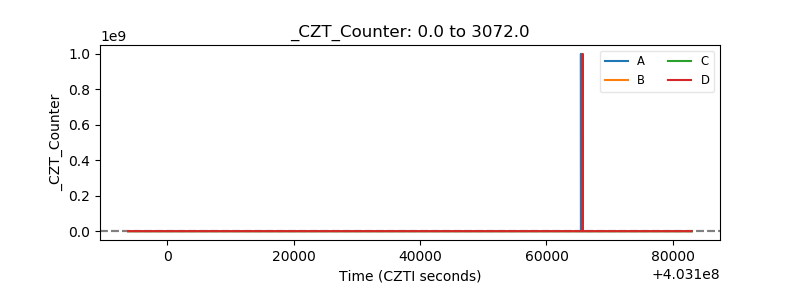 |
| +2.5 Volts monitor |  |
| +5 Volts monitor | 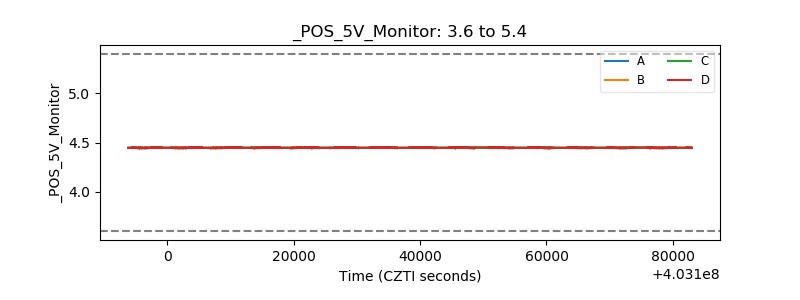 |
| _ROLL_ROT | 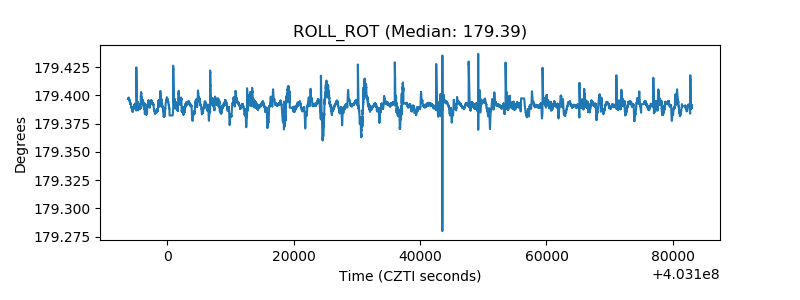 |
| _Roll_DEC | 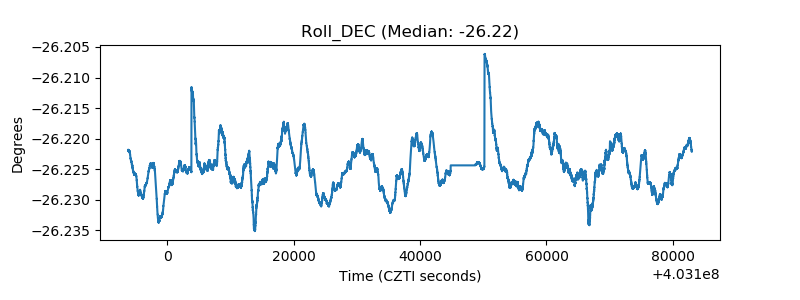 |
| _Roll_RA | 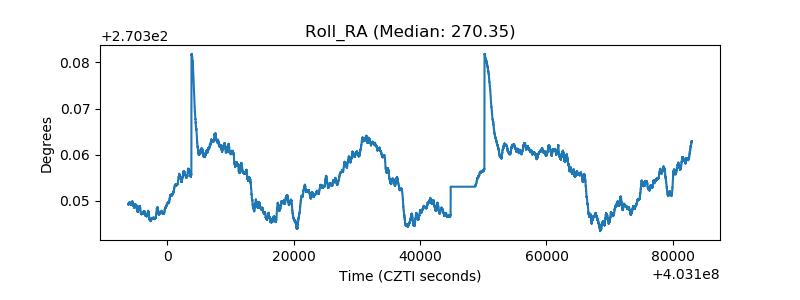 |
| Veto Counter | 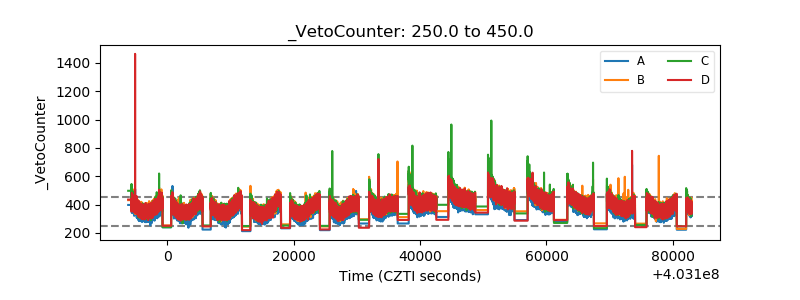 |