| Param | Original file | Final file |
|---|---|---|
| Filename | modeM0/AS1A11_044T01_9000005360cztM0_level2.fits | modeM0/AS1A11_044T01_9000005360cztM0_level2_quad_clean.evt |
| Size (bytes) | 588,674,880 | 882,360,000 |
| Size | 561.4 MB | 841.5 MB |
| Events in quadrant A | 3,584,150 | 5,906,564 |
| Events in quadrant B | 3,428,418 | 5,872,049 |
| Events in quadrant C | 3,519,572 | 5,754,321 |
| Events in quadrant D | 2,894,264 | 4,795,958 |
| Mode SS | |||
|---|---|---|---|
| Quadrant | BADHDUFLAG | Total packets | Discarded packets |
| A | 0 | 1314 | 0 |
| B | 0 | 1314 | 0 |
| C | 0 | 1314 | 0 |
| D | 0 | 1314 | 0 |
| Mode M9 | |||
|---|---|---|---|
| Quadrant | BADHDUFLAG | Total packets | Discarded packets |
| A | 0 | 237 | 0 |
| B | 0 | 237 | 0 |
| C | 0 | 237 | 0 |
| D | 0 | 237 | 0 |
| Mode M0 | |||
|---|---|---|---|
| Quadrant | BADHDUFLAG | Total packets | Discarded packets |
| A | 0 | 138531 | 0 |
| B | 0 | 152427 | 0 |
| C | 0 | 156604 | 0 |
| D | 0 | 204906 | 0 |
| Quadrant | Total seconds | Saturated seconds | Saturation percentage |
|---|---|---|---|
| A | 64101 | 178 | 0.277687% |
| B | 64101 | 1856 | 2.895431% |
| C | 64101 | 2070 | 3.229279% |
| D | 64101 | 7612 | 11.875010% |
Noise dominated data is calculated using 1-second bins in cleaned event files. If a bin has >2000 counts, and if more than 50% of those come from <1% of pixels, then it is considered to be noise-dominated and hence unusable.
| Quadrant | # 1 sec bins | Bins with >0 counts | Bins with >2000 counts | High rate bins dominated by noise | Noise dominated (total time) | Noise dominated (detector-on time) | Marked lightcurve |
|---|---|---|---|---|---|---|---|
| A | 87998 | 64102 | 0 | 0 | 0.00% | 0.00% |  |
| B | 87998 | 64091 | 0 | 0 | 0.00% | 0.00% | 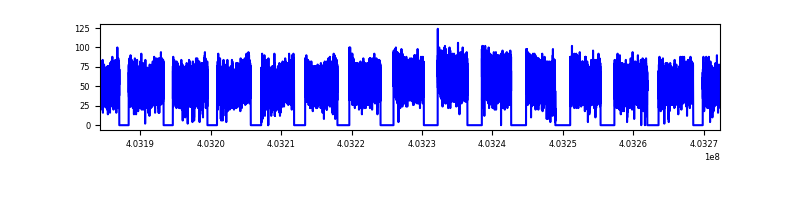 |
| C | 87998 | 63982 | 0 | 0 | 0.00% | 0.00% |  |
| D | 87998 | 63950 | 0 | 0 | 0.00% | 0.00% |  |
Top three noisy pixels from each quadrant. If the there are fewer than three noisy pixels in the level2.evt file, extra rows are filled as -1
| Pixel properties | Quadrant properties | ||||||
|---|---|---|---|---|---|---|---|
| Quadrant | DetID | PixID | Counts | Sigma | Mean | Median | Sigma |
| A | 9 | 19 | 2956 | 8.91 | 939 | 887 | 232.1 |
| A | 7 | 110 | 2920 | 8.76 | 939 | 887 | 232.1 |
| A | 0 | 29 | 2777 | 8.14 | 939 | 887 | 232.1 |
| B | 2 | 9 | 2972 | 11.99 | 909 | 871 | 175.3 |
| B | 3 | 80 | 2777 | 10.87 | 909 | 871 | 175.3 |
| B | 5 | 128 | 2417 | 8.82 | 909 | 871 | 175.3 |
| C | 1 | 81 | 2931 | 8.69 | 930 | 877 | 236.3 |
| C | 3 | 203 | 2823 | 8.24 | 930 | 877 | 236.3 |
| C | 1 | 80 | 2816 | 8.21 | 930 | 877 | 236.3 |
| D | 10 | 113 | 2118 | 6.24 | 826 | 754 | 218.7 |
| D | 10 | 189 | 2112 | 6.21 | 826 | 754 | 218.7 |
| D | 6 | 67 | 2090 | 6.11 | 826 | 754 | 218.7 |
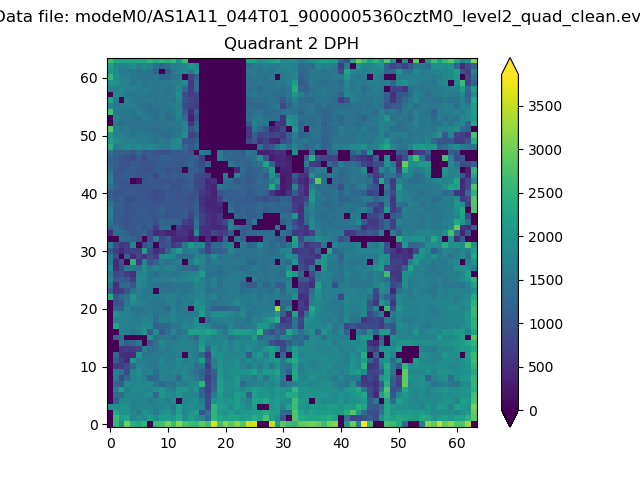
Histogram calculated using DETX and DETY for each event in the final _common_clean file
| Quadrant A | 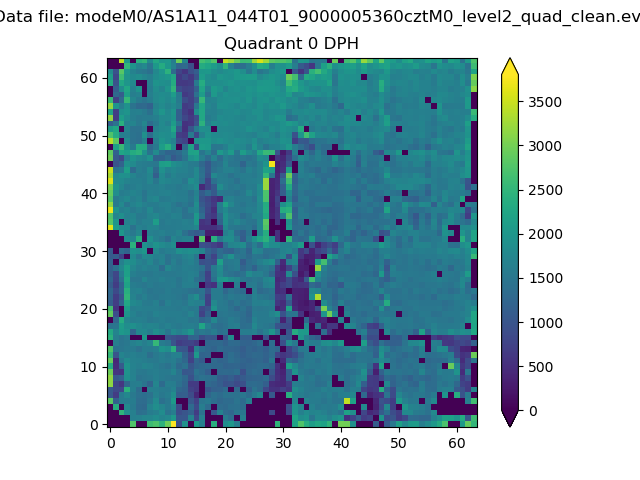 |
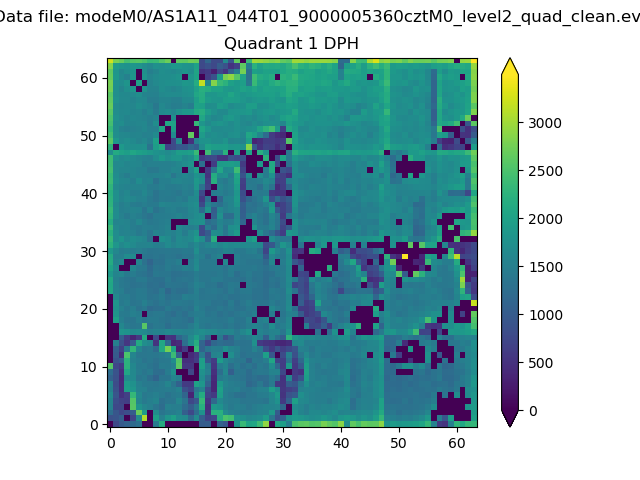 |
Quadrant B |
|---|---|---|---|
| Quadrant D | 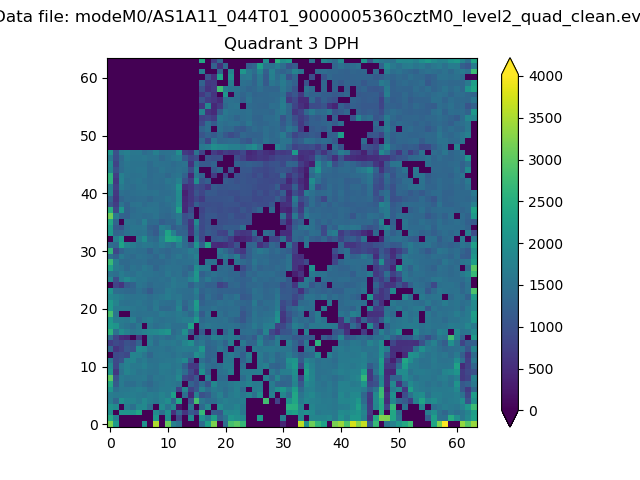 |
 |
Quadrant C |
| Plot type | Count rate plots | Images |
|---|---|---|
| Comparison with Poisson distribution Blue bars denote a histogram of data divided into 1 sec bins. Red curve is a Poisson curve with rate = median count rate of data. |
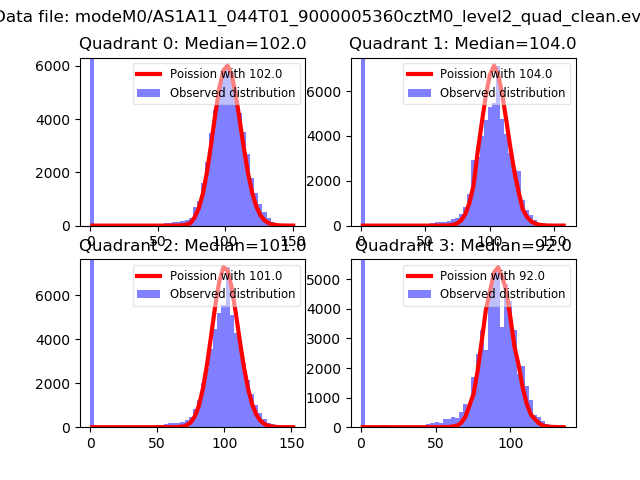 |
 |
| Quadrant-wise count rates Data is divided into 100 sec bins |
 |
|
| Module-wise count rates for Quadrant A Data is divided into 100 sec bins |
 |
 |
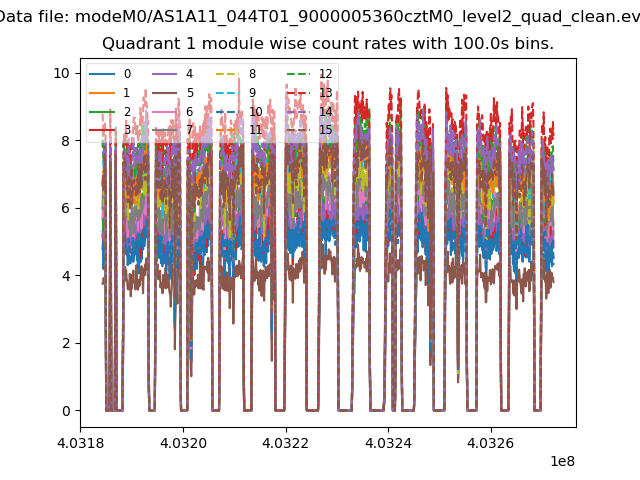
| Module-wise count rates for Quadrant B Data is divided into 100 sec bins |
 |
 |
| Module-wise count rates for Quadrant C Data is divided into 100 sec bins |
 |
 |
| Module-wise count rates for Quadrant D Data is divided into 100 sec bins |
 |
 |
| Parameter | Plot |
|---|---|
| CZT HV Monitor |  |
| D_VDD |  |
| Temperature 1 |  |
| Veto HV Monitor | 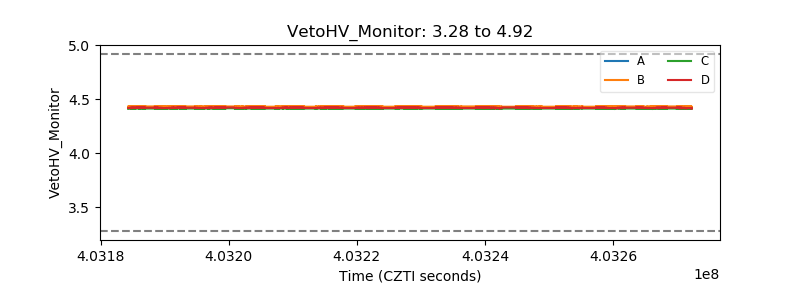 |
| Veto LLD | 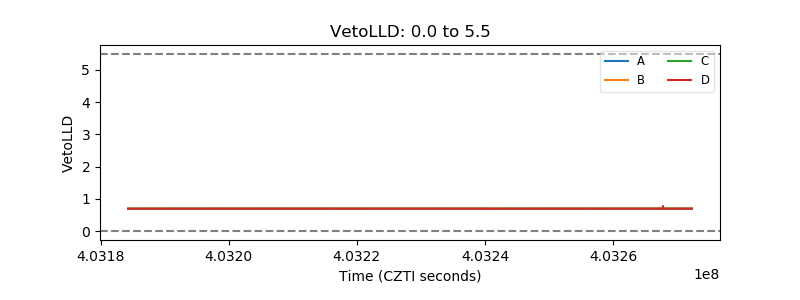 |
| Alpha Counter |  |
| _CPM_Rate |  |
| CZT Counter | 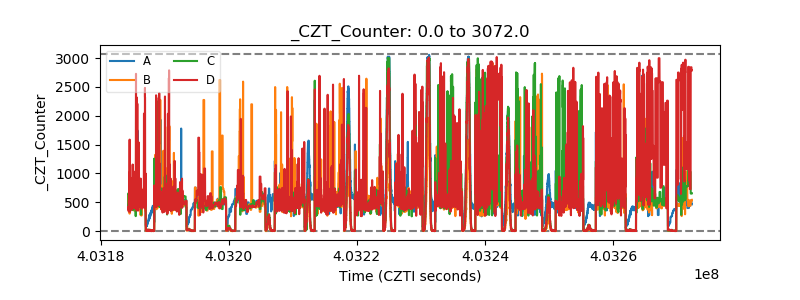 |
| +2.5 Volts monitor | 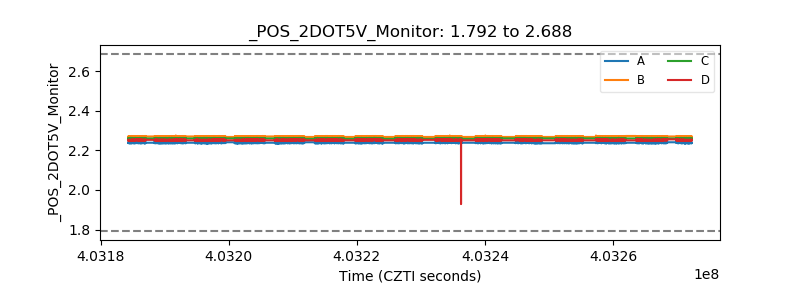 |
| +5 Volts monitor | 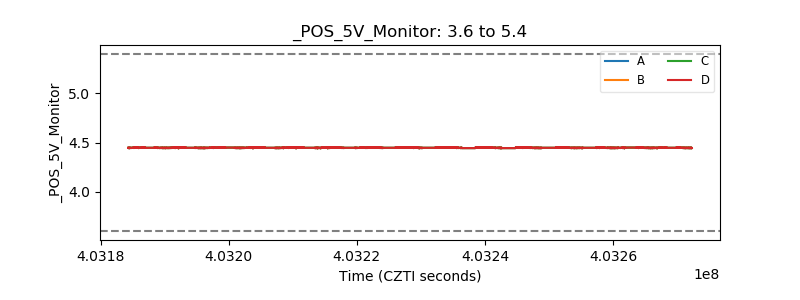 |
| _ROLL_ROT |  |
| _Roll_DEC | 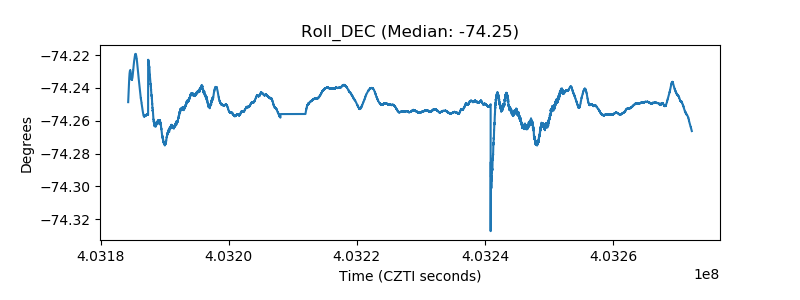 |
| _Roll_RA |  |
| Veto Counter |  |