| Param | Original file | Final file |
|---|---|---|
| Filename | modeM0/AS1A11_065T21_9000005364cztM0_level2.fits | modeM0/AS1A11_065T21_9000005364cztM0_level2_quad_clean.evt |
| Size (bytes) | 662,993,280 | 718,640,640 |
| Size | 632.3 MB | 685.3 MB |
| Events in quadrant A | 3,998,866 | 4,429,773 |
| Events in quadrant B | 3,850,034 | 4,449,632 |
| Events in quadrant C | 3,961,076 | 4,266,864 |
| Events in quadrant D | 3,327,726 | 3,679,635 |
| Mode M9 | |||
|---|---|---|---|
| Quadrant | BADHDUFLAG | Total packets | Discarded packets |
| A | 0 | 269 | 0 |
| B | 0 | 269 | 0 |
| C | 0 | 269 | 0 |
| D | 0 | 269 | 0 |
| Mode M0 | |||
|---|---|---|---|
| Quadrant | BADHDUFLAG | Total packets | Discarded packets |
| A | 0 | 174017 | 0 |
| B | 0 | 156325 | 0 |
| C | 0 | 156520 | 0 |
| D | 0 | 230448 | 0 |
| Mode SS | |||
|---|---|---|---|
| Quadrant | BADHDUFLAG | Total packets | Discarded packets |
| A | 0 | 1472 | 0 |
| B | 0 | 1472 | 0 |
| C | 0 | 1472 | 0 |
| D | 0 | 1472 | 0 |
| Quadrant | Total seconds | Saturated seconds | Saturation percentage |
|---|---|---|---|
| A | 72049 | 701 | 0.972949% |
| B | 72047 | 932 | 1.293600% |
| C | 72031 | 710 | 0.985687% |
| D | 72007 | 4280 | 5.943867% |
Noise dominated data is calculated using 1-second bins in cleaned event files. If a bin has >2000 counts, and if more than 50% of those come from <1% of pixels, then it is considered to be noise-dominated and hence unusable.
| Quadrant | # 1 sec bins | Bins with >0 counts | Bins with >2000 counts | High rate bins dominated by noise | Noise dominated (total time) | Noise dominated (detector-on time) | Marked lightcurve |
|---|---|---|---|---|---|---|---|
| A | 98930 | 72068 | 0 | 0 | 0.00% | 0.00% |  |
| B | 98930 | 72049 | 0 | 0 | 0.00% | 0.00% |  |
| C | 98930 | 72051 | 0 | 0 | 0.00% | 0.00% |  |
| D | 98930 | 72045 | 0 | 0 | 0.00% | 0.00% |  |
Top three noisy pixels from each quadrant. If the there are fewer than three noisy pixels in the level2.evt file, extra rows are filled as -1
| Pixel properties | Quadrant properties | ||||||
|---|---|---|---|---|---|---|---|
| Quadrant | DetID | PixID | Counts | Sigma | Mean | Median | Sigma |
| A | 0 | 29 | 3245 | 8.64 | 1045 | 980 | 262.3 |
| A | 7 | 110 | 3244 | 8.63 | 1045 | 980 | 262.3 |
| A | 9 | 19 | 3216 | 8.53 | 1045 | 980 | 262.3 |
| B | 2 | 9 | 3241 | 11.46 | 1018 | 972 | 198.0 |
| B | 3 | 80 | 3005 | 10.27 | 1018 | 972 | 198.0 |
| B | 3 | 17 | 2675 | 8.6 | 1018 | 972 | 198.0 |
| C | 1 | 81 | 3192 | 8.33 | 1047 | 984 | 265.1 |
| C | 1 | 80 | 3090 | 7.95 | 1047 | 984 | 265.1 |
| C | 3 | 203 | 3041 | 7.76 | 1047 | 984 | 265.1 |
| D | 7 | 3 | 2455 | 6.22 | 952 | 868 | 255.0 |
| D | 4 | 160 | 2440 | 6.17 | 952 | 868 | 255.0 |
| D | 10 | 189 | 2429 | 6.12 | 952 | 868 | 255.0 |
Histogram calculated using DETX and DETY for each event in the final _common_clean file
| Quadrant A |  |
 |
Quadrant B |
|---|---|---|---|
| Quadrant D | 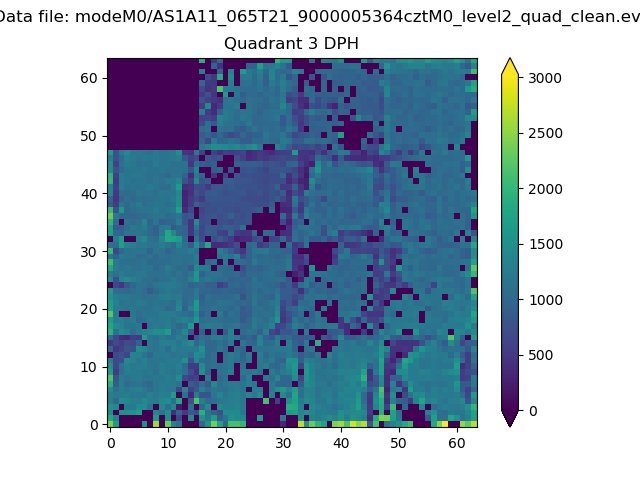 |
 |
Quadrant C |
| Plot type | Count rate plots | Images |
|---|---|---|
| Comparison with Poisson distribution Blue bars denote a histogram of data divided into 1 sec bins. Red curve is a Poisson curve with rate = median count rate of data. |
 |
 |
| Quadrant-wise count rates Data is divided into 100 sec bins |
 |
|
| Module-wise count rates for Quadrant A Data is divided into 100 sec bins |
 |
 |
| Module-wise count rates for Quadrant B Data is divided into 100 sec bins |
 |
 |
| Module-wise count rates for Quadrant C Data is divided into 100 sec bins |
 |
 |
| Module-wise count rates for Quadrant D Data is divided into 100 sec bins |
 |
 |
| Parameter | Plot |
|---|---|
| CZT HV Monitor | 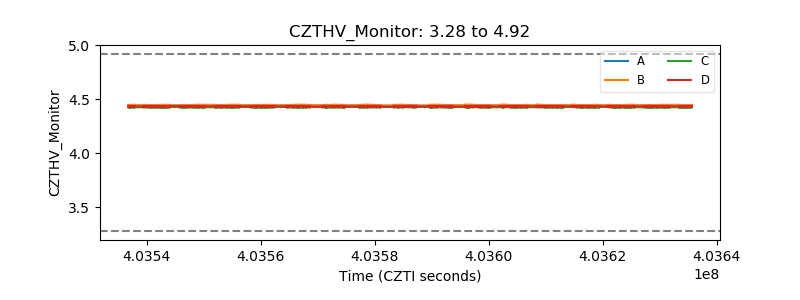 |
| D_VDD | 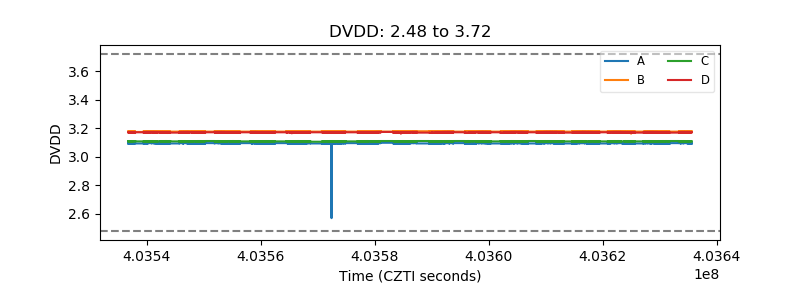 |
| Temperature 1 |  |
| Veto HV Monitor |  |
| Veto LLD |  |
| Alpha Counter |  |
| _CPM_Rate |  |
| CZT Counter |  |
| +2.5 Volts monitor |  |
| +5 Volts monitor |  |
| _ROLL_ROT |  |
| _Roll_DEC |  |
| _Roll_RA |  |
| Veto Counter |  |