| Param | Original file | Final file |
|---|---|---|
| Filename | modeM0/AS1A07_145T01_9000005370cztM0_level2.fits | modeM0/AS1A07_145T01_9000005370cztM0_level2_quad_clean.evt |
| Size (bytes) | 11,334,585,600 | 7,363,759,680 |
| Size | 10.6 GB | 6.9 GB |
| Events in quadrant A | 80,214,994 | 49,244,614 |
| Events in quadrant B | 81,741,659 | 46,983,886 |
| Events in quadrant C | 75,122,083 | 46,421,527 |
| Events in quadrant D | 62,816,348 | 36,964,642 |
| Mode M9 | |||
|---|---|---|---|
| Quadrant | BADHDUFLAG | Total packets | Discarded packets |
| A | 0 | 11 | 0 |
| B | 0 | 11 | 0 |
| C | 0 | 11 | 0 |
| D | 0 | 11 | 0 |
| Mode SS | |||
|---|---|---|---|
| Quadrant | BADHDUFLAG | Total packets | Discarded packets |
| A | 0 | 13068 | 0 |
| B | 0 | 13066 | 0 |
| C | 0 | 13068 | 0 |
| D | 0 | 13056 | 0 |
| Mode M0 | |||
|---|---|---|---|
| Quadrant | BADHDUFLAG | Total packets | Discarded packets |
| A | 0 | 1378798 | 0 |
| B | 0 | 1371767 | 0 |
| C | 0 | 1387903 | 0 |
| D | 0 | 2412246 | 0 |
| Quadrant | Total seconds | Saturated seconds | Saturation percentage |
|---|---|---|---|
| A | 634273 | 1890 | 0.297979% |
| B | 634347 | 6396 | 1.008281% |
| C | 634405 | 5839 | 0.920390% |
| D | 633340 | 88193 | 13.925064% |
Noise dominated data is calculated using 1-second bins in cleaned event files. If a bin has >2000 counts, and if more than 50% of those come from <1% of pixels, then it is considered to be noise-dominated and hence unusable.
| Quadrant | # 1 sec bins | Bins with >0 counts | Bins with >2000 counts | High rate bins dominated by noise | Noise dominated (total time) | Noise dominated (detector-on time) | Marked lightcurve |
|---|---|---|---|---|---|---|---|
| A | 902430 | 635826 | 0 | 0 | 0.00% | 0.00% |  |
| B | 902430 | 635930 | 0 | 0 | 0.00% | 0.00% | 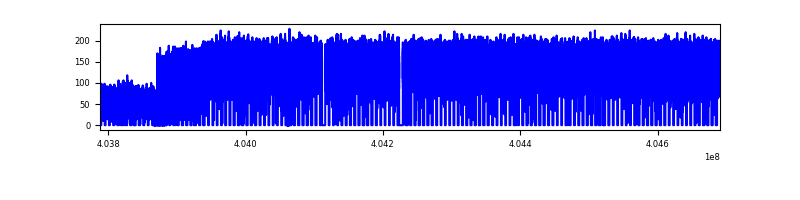 |
| C | 902430 | 636065 | 0 | 0 | 0.00% | 0.00% | 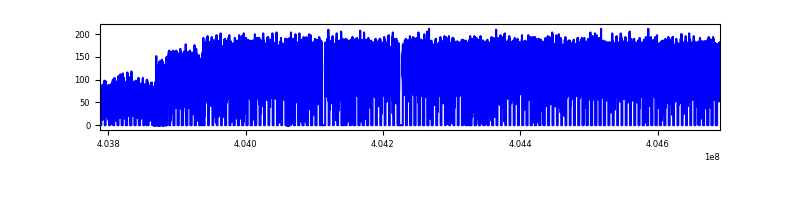 |
| D | 902430 | 633394 | 0 | 0 | 0.00% | 0.00% | 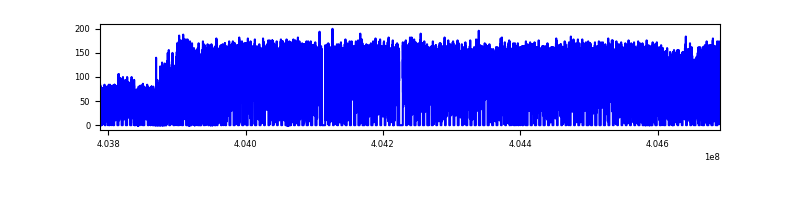 |
Top three noisy pixels from each quadrant. If the there are fewer than three noisy pixels in the level2.evt file, extra rows are filled as -1
| Pixel properties | Quadrant properties | ||||||
|---|---|---|---|---|---|---|---|
| Quadrant | DetID | PixID | Counts | Sigma | Mean | Median | Sigma |
| A | 10 | 180 | 53370 | 7.04 | 21175 | 20292 | 4695.9 |
| A | 14 | 235 | 44078 | 5.07 | 21175 | 20292 | 4695.9 |
| A | -1 | -1 | -1 | -1.0 | 21175 | 20292 | 4695.9 |
| B | 2 | 9 | 44329 | 5.02 | 21917 | 21143 | 4619.3 |
| B | -1 | -1 | -1 | -1.0 | 21917 | 21143 | 4619.3 |
| B | -1 | -1 | -1 | -1.0 | 21917 | 21143 | 4619.3 |
| C | 3 | 203 | 45847 | 5.28 | 20087 | 19623 | 4965.1 |
| C | -1 | -1 | -1 | -1.0 | 20087 | 19623 | 4965.1 |
| C | -1 | -1 | -1 | -1.0 | 20087 | 19623 | 4965.1 |
| D | 6 | 60 | 40388 | 5.21 | 18248 | 17294 | 4436.6 |
| D | -1 | -1 | -1 | -1.0 | 18248 | 17294 | 4436.6 |
| D | -1 | -1 | -1 | -1.0 | 18248 | 17294 | 4436.6 |
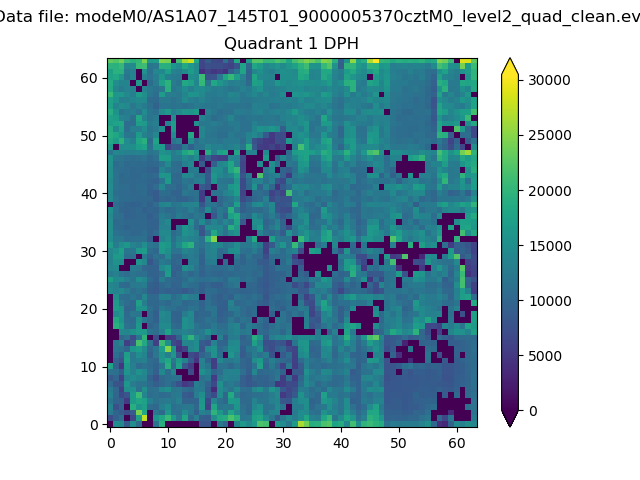
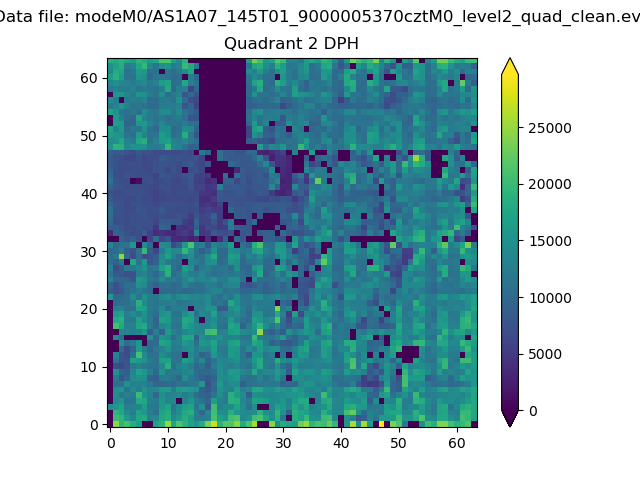
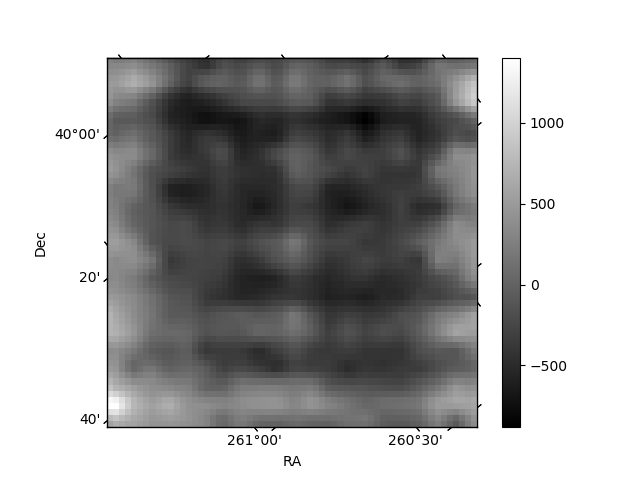
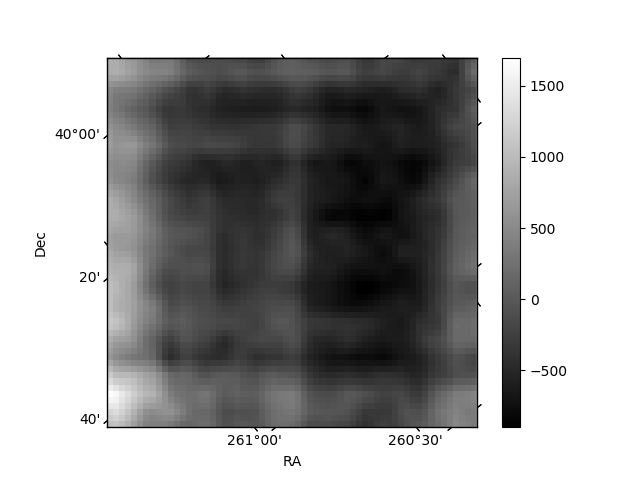
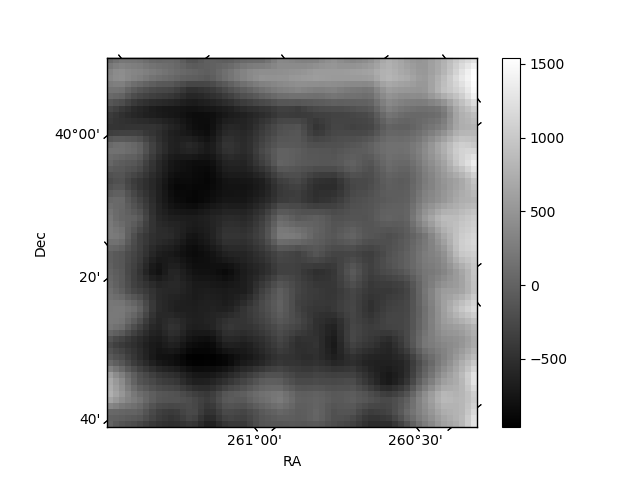
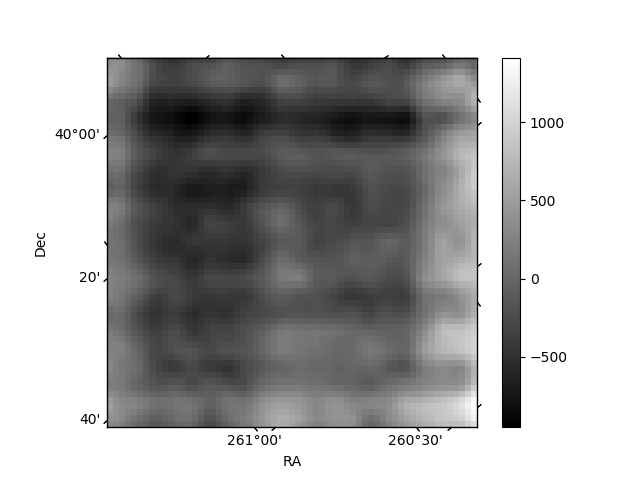
Histogram calculated using DETX and DETY for each event in the final _common_clean file
| Quadrant A | 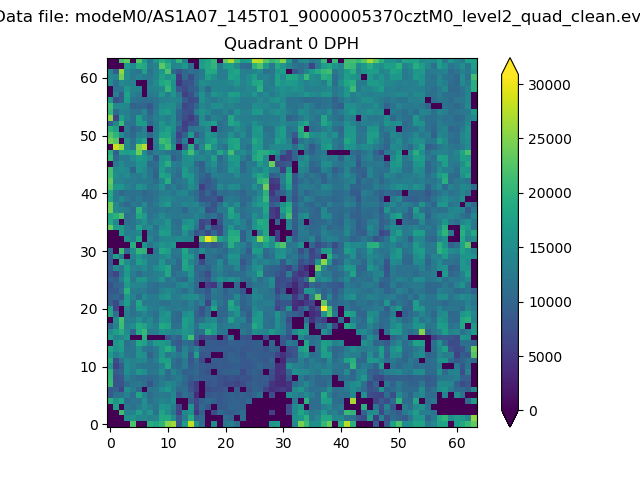 |
 |
Quadrant B |
|---|---|---|---|
| Quadrant D | 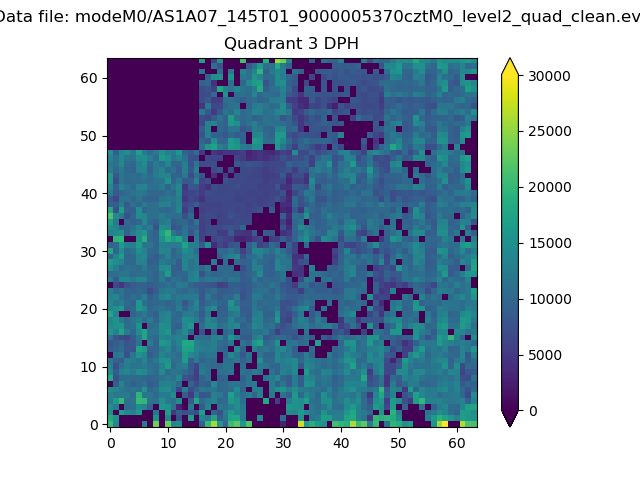 |
 |
Quadrant C |
| Plot type | Count rate plots | Images |
|---|---|---|
| Comparison with Poisson distribution Blue bars denote a histogram of data divided into 1 sec bins. Red curve is a Poisson curve with rate = median count rate of data. |
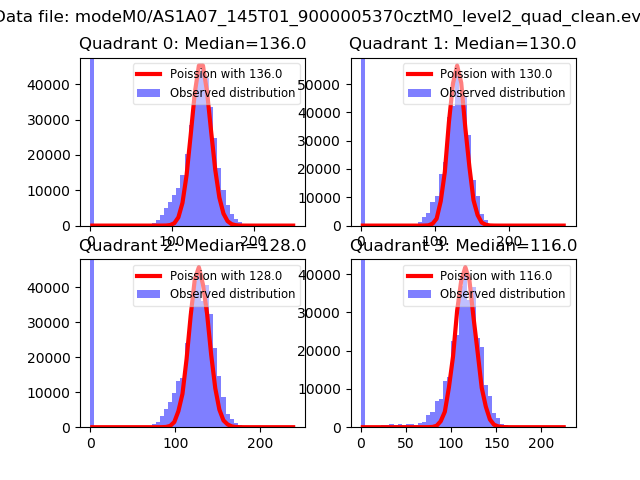 |
 |
| Quadrant-wise count rates Data is divided into 100 sec bins |
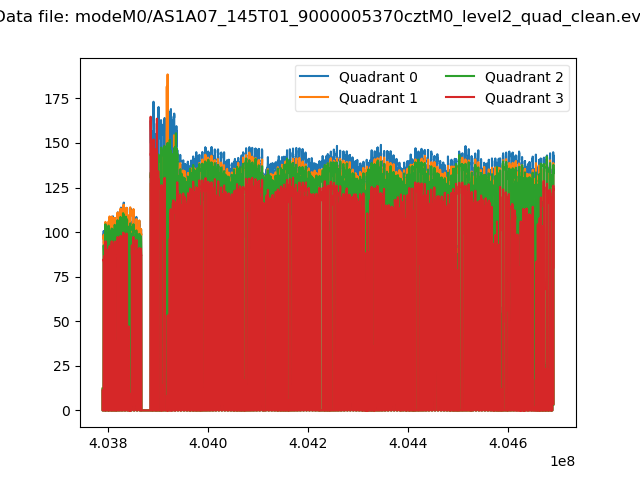 |
|
| Module-wise count rates for Quadrant A Data is divided into 100 sec bins |
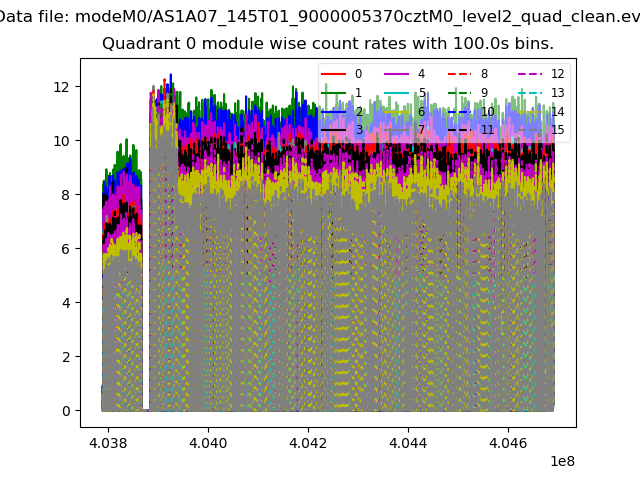 |
 |
| Module-wise count rates for Quadrant B Data is divided into 100 sec bins |
 |
 |
| Module-wise count rates for Quadrant C Data is divided into 100 sec bins |
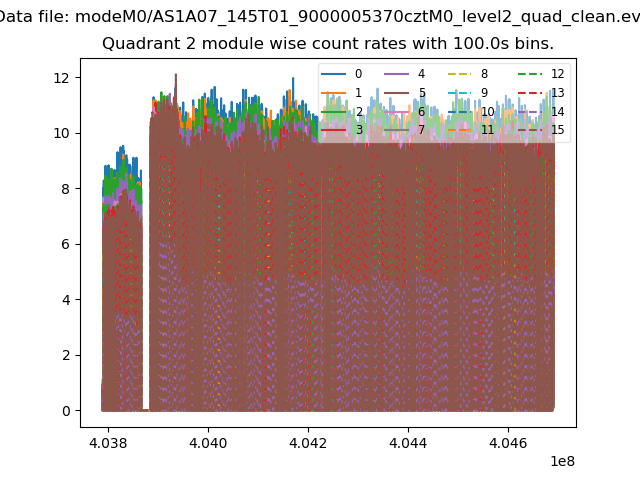 |
 |
| Module-wise count rates for Quadrant D Data is divided into 100 sec bins |
 |
 |
| Parameter | Plot |
|---|---|
| CZT HV Monitor |  |
| D_VDD |  |
| Temperature 1 |  |
| Veto HV Monitor | 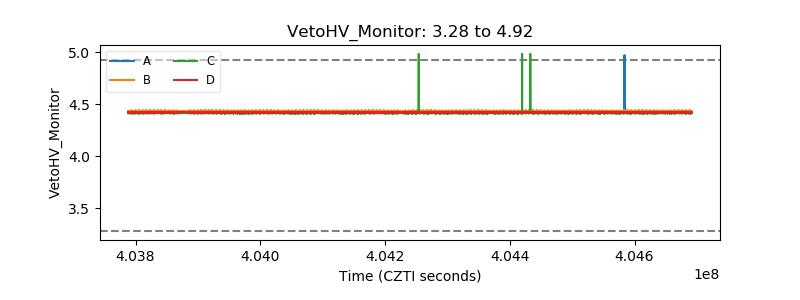 |
| Veto LLD | 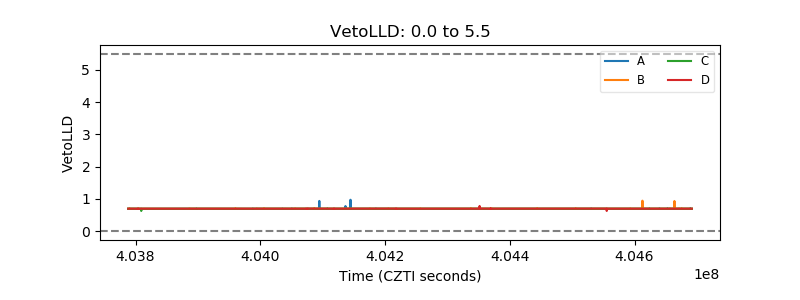 |
| Alpha Counter | 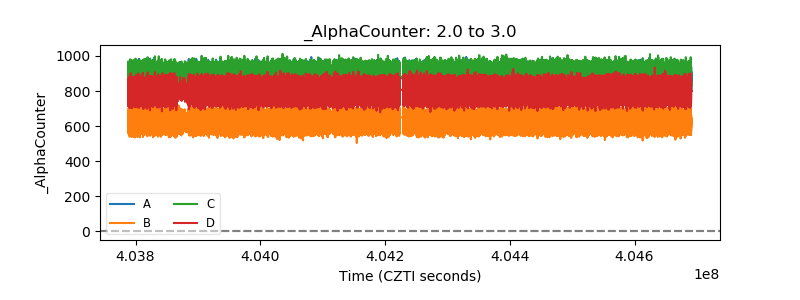 |
| _CPM_Rate |  |
| CZT Counter | 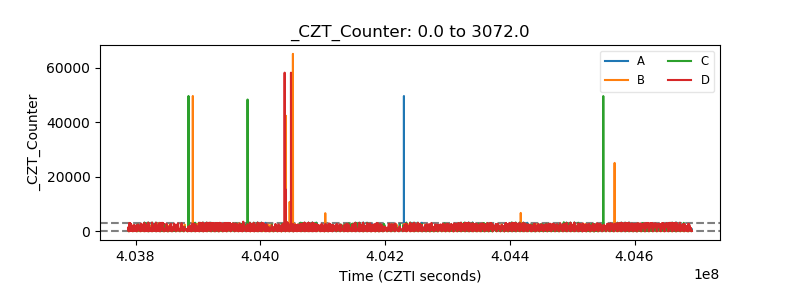 |
| +2.5 Volts monitor | 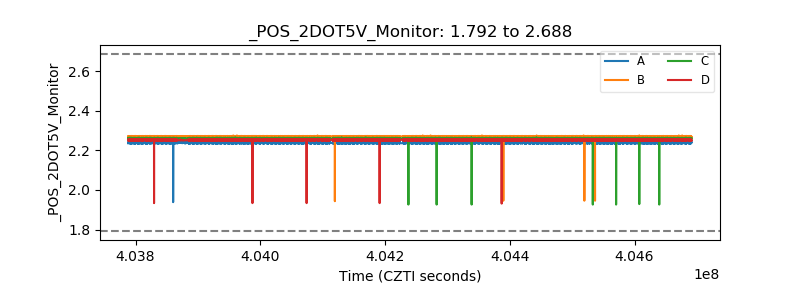 |
| +5 Volts monitor | 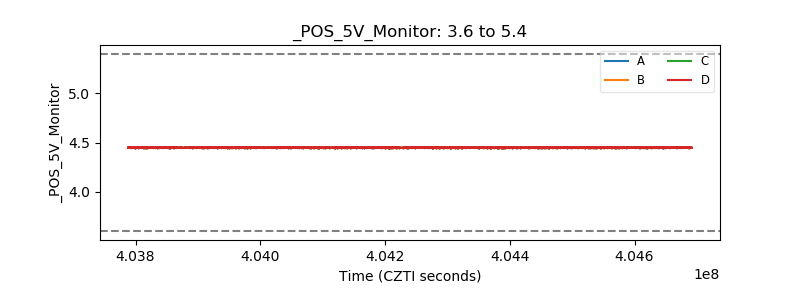 |
| _ROLL_ROT | 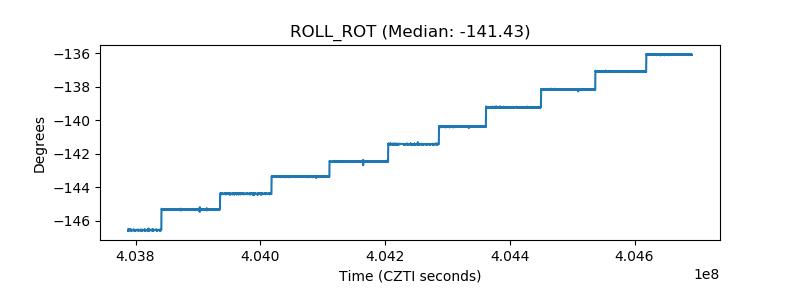 |
| _Roll_DEC | 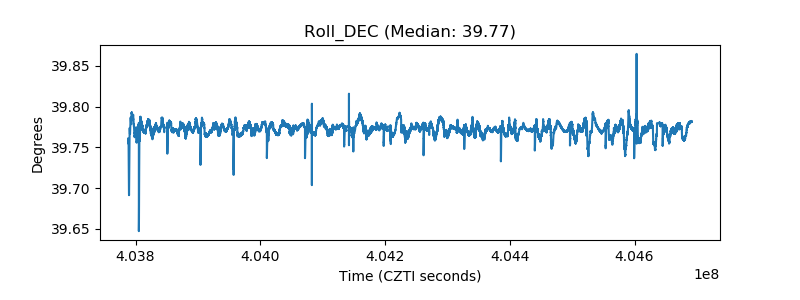 |
| _Roll_RA | 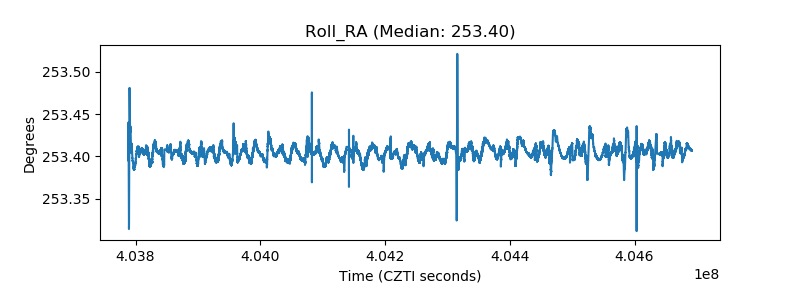 |
| Veto Counter |  |