| Param | Original file | Final file |
|---|---|---|
| Filename | modeM0/AS1C07_001T12_9000005372cztM0_level2.fits | modeM0/AS1C07_001T12_9000005372cztM0_level2_quad_clean.evt |
| Size (bytes) | 654,485,760 | 934,194,240 |
| Size | 624.2 MB | 890.9 MB |
| Events in quadrant A | 4,054,492 | 6,733,434 |
| Events in quadrant B | 3,899,718 | 6,730,916 |
| Events in quadrant C | 4,032,700 | 6,539,556 |
| Events in quadrant D | 2,630,408 | 3,105,307 |
| Mode SS | |||
|---|---|---|---|
| Quadrant | BADHDUFLAG | Total packets | Discarded packets |
| A | 0 | 1546 | 0 |
| B | 0 | 1546 | 0 |
| C | 0 | 1546 | 0 |
| D | 0 | 1546 | 0 |
| Mode M9 | |||
|---|---|---|---|
| Quadrant | BADHDUFLAG | Total packets | Discarded packets |
| A | 0 | 270 | 0 |
| B | 0 | 270 | 0 |
| C | 0 | 270 | 0 |
| D | 0 | 270 | 0 |
| Mode M0 | |||
|---|---|---|---|
| Quadrant | BADHDUFLAG | Total packets | Discarded packets |
| A | 0 | 167252 | 0 |
| B | 0 | 164477 | 0 |
| C | 0 | 157034 | 0 |
| D | 0 | 480529 | 0 |
| Quadrant | Total seconds | Saturated seconds | Saturation percentage |
|---|---|---|---|
| A | 75618 | 550 | 0.727340% |
| B | 75618 | 784 | 1.036790% |
| C | 75618 | 217 | 0.286969% |
| D | 75618 | 38321 | 50.677087% |
Noise dominated data is calculated using 1-second bins in cleaned event files. If a bin has >2000 counts, and if more than 50% of those come from <1% of pixels, then it is considered to be noise-dominated and hence unusable.
| Quadrant | # 1 sec bins | Bins with >0 counts | Bins with >2000 counts | High rate bins dominated by noise | Noise dominated (total time) | Noise dominated (detector-on time) | Marked lightcurve |
|---|---|---|---|---|---|---|---|
| A | 102533 | 75615 | 0 | 0 | 0.00% | 0.00% | 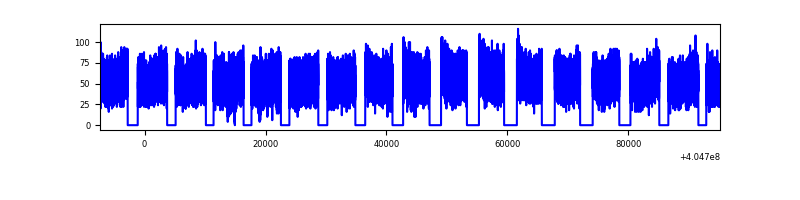 |
| B | 102533 | 75608 | 0 | 0 | 0.00% | 0.00% | 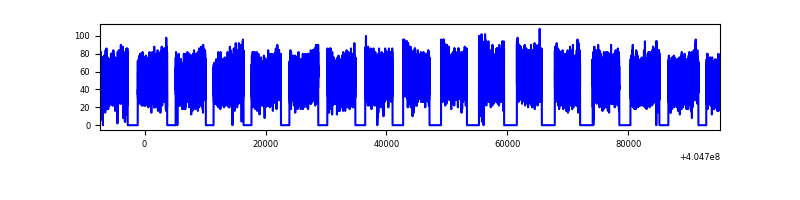 |
| C | 102533 | 75617 | 0 | 0 | 0.00% | 0.00% | 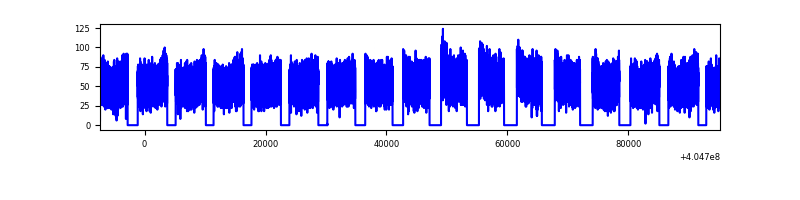 |
| D | 102533 | 75543 | 0 | 0 | 0.00% | 0.00% | 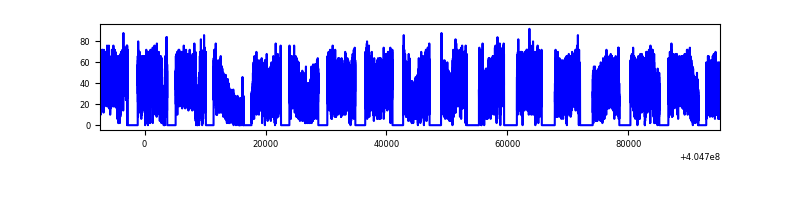 |
Top three noisy pixels from each quadrant. If the there are fewer than three noisy pixels in the level2.evt file, extra rows are filled as -1
| Pixel properties | Quadrant properties | ||||||
|---|---|---|---|---|---|---|---|
| Quadrant | DetID | PixID | Counts | Sigma | Mean | Median | Sigma |
| A | 0 | 29 | 3400 | 9.0 | 1061 | 1000 | 266.6 |
| A | 9 | 19 | 3372 | 8.9 | 1061 | 1000 | 266.6 |
| A | 7 | 110 | 3284 | 8.57 | 1061 | 1000 | 266.6 |
| B | 2 | 9 | 3316 | 11.6 | 1033 | 989 | 200.6 |
| B | 3 | 80 | 3164 | 10.84 | 1033 | 989 | 200.6 |
| B | 5 | 128 | 2850 | 9.28 | 1033 | 989 | 200.6 |
| C | 1 | 81 | 3389 | 8.75 | 1068 | 1008 | 272.2 |
| C | 1 | 80 | 3288 | 8.38 | 1068 | 1008 | 272.2 |
| C | 3 | 203 | 3232 | 8.17 | 1068 | 1008 | 272.2 |
| D | 6 | 231 | 1982 | 6.32 | 753 | 685 | 205.2 |
| D | 4 | 160 | 1980 | 6.31 | 753 | 685 | 205.2 |
| D | 3 | 14 | 1966 | 6.24 | 753 | 685 | 205.2 |
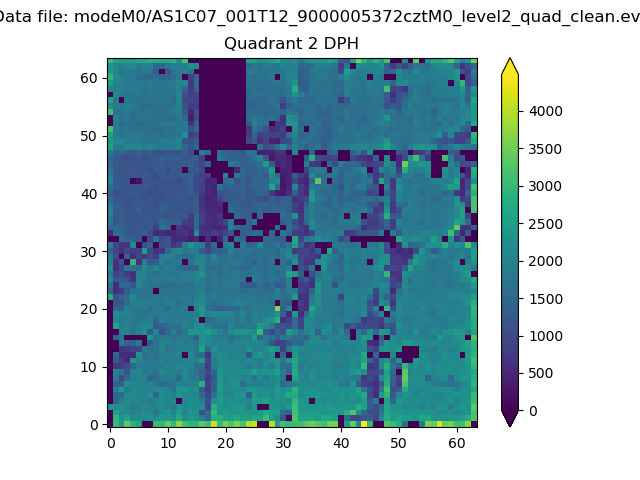
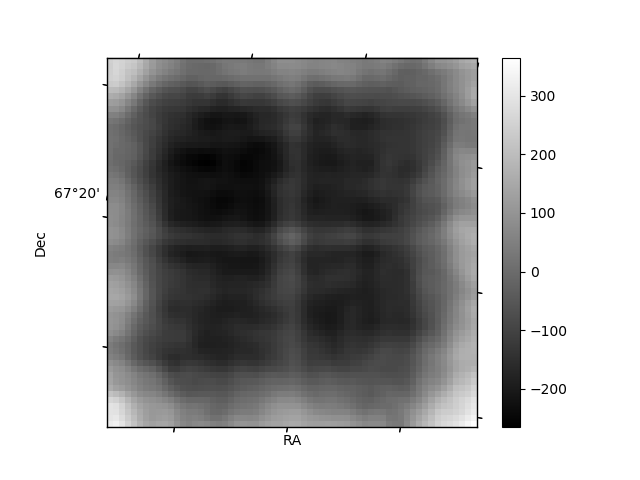
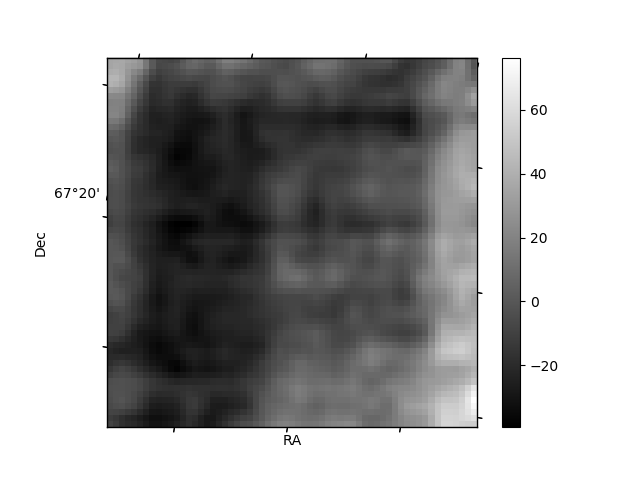
Histogram calculated using DETX and DETY for each event in the final _common_clean file
| Quadrant A | 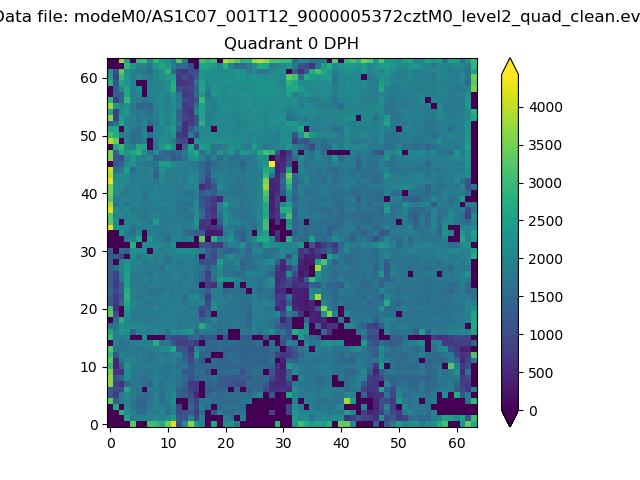 |
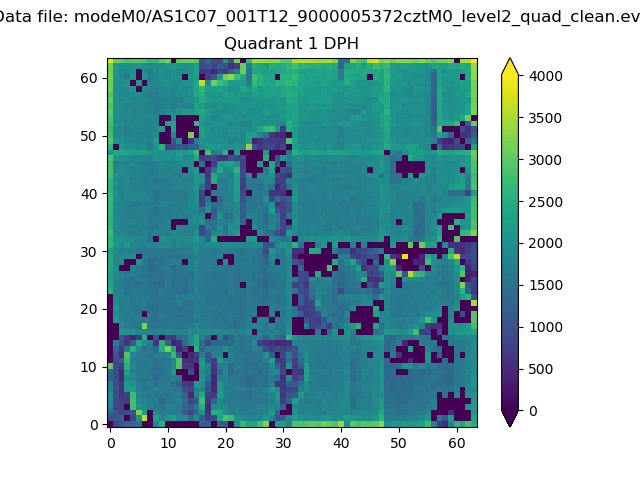 |
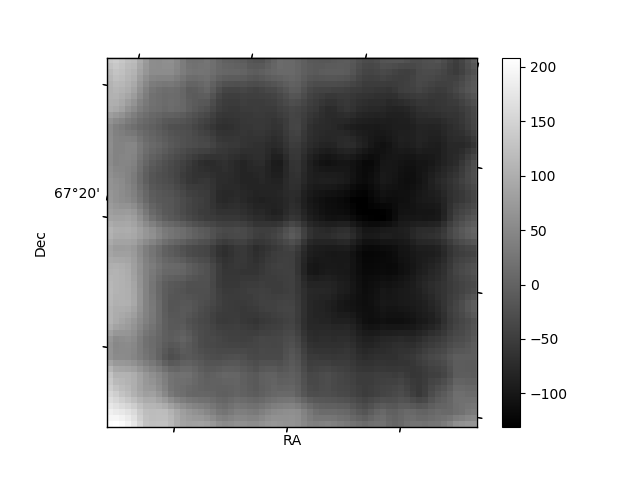
Quadrant B |
|---|---|---|---|
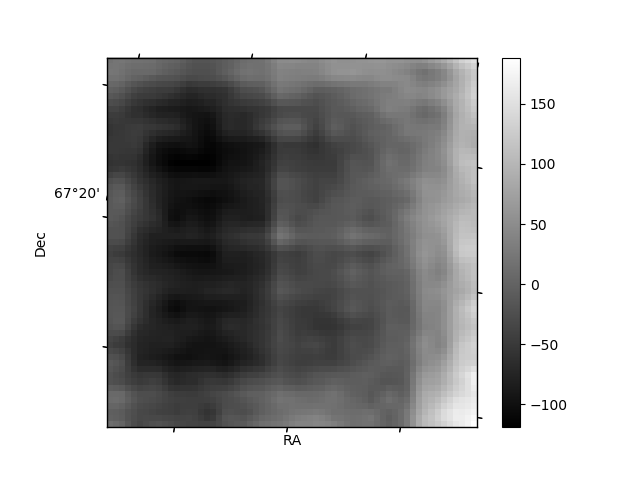
| Quadrant D | 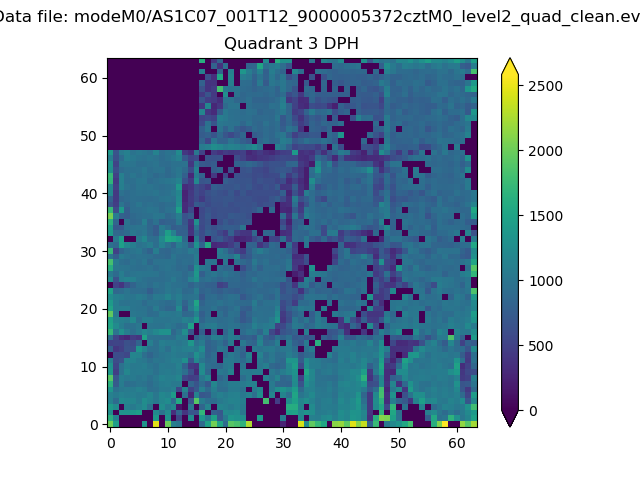 |
 |
Quadrant C |
| Plot type | Count rate plots | Images |
|---|---|---|
| Comparison with Poisson distribution Blue bars denote a histogram of data divided into 1 sec bins. Red curve is a Poisson curve with rate = median count rate of data. |
 |
 |
| Quadrant-wise count rates Data is divided into 100 sec bins |
 |
|
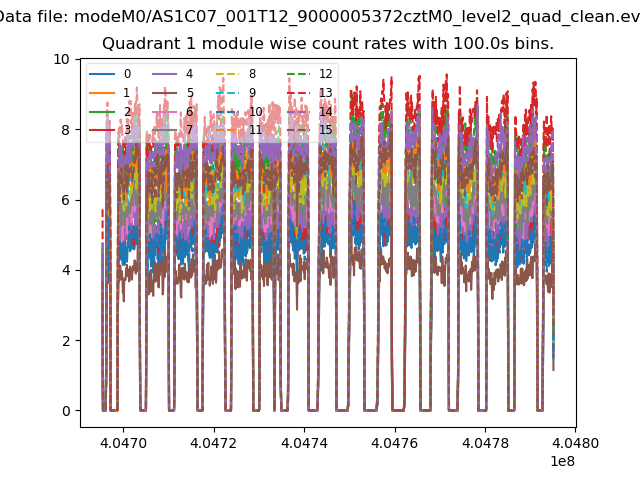
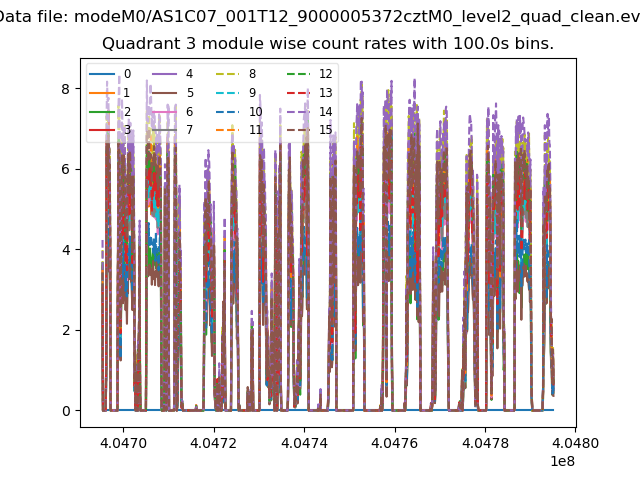
| Module-wise count rates for Quadrant A Data is divided into 100 sec bins |
 |
 |
| Module-wise count rates for Quadrant B Data is divided into 100 sec bins |
 |
 |
| Module-wise count rates for Quadrant C Data is divided into 100 sec bins |
 |
 |
| Module-wise count rates for Quadrant D Data is divided into 100 sec bins |
 |
 |
| Parameter | Plot |
|---|---|
| CZT HV Monitor | 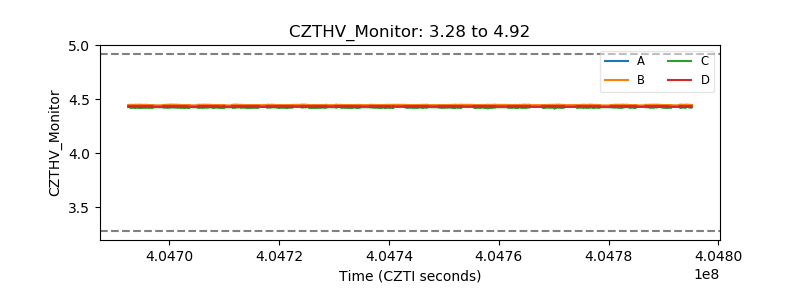 |
| D_VDD | 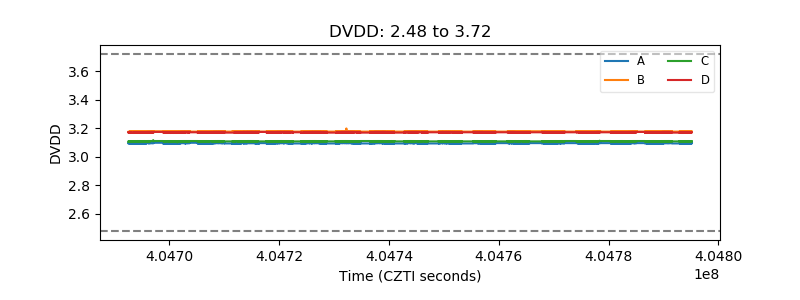 |
| Temperature 1 | 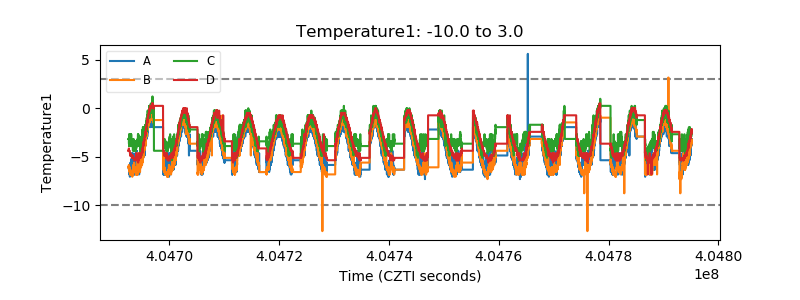 |
| Veto HV Monitor |  |
| Veto LLD | 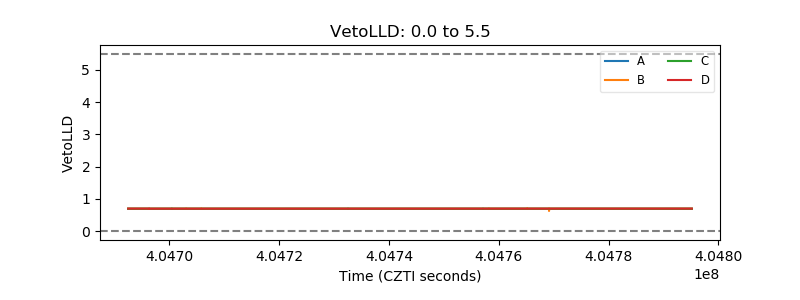 |
| Alpha Counter | 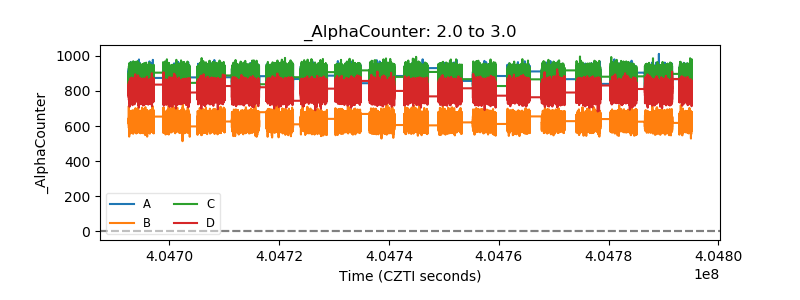 |
| _CPM_Rate | 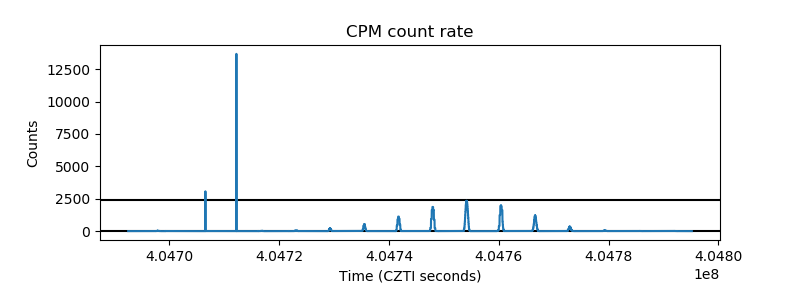 |
| CZT Counter | 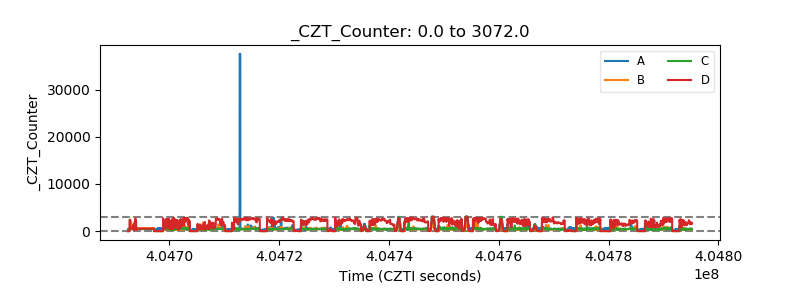 |
| +2.5 Volts monitor | 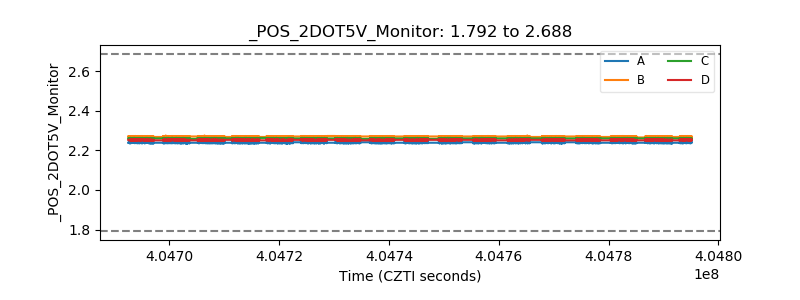 |
| +5 Volts monitor | 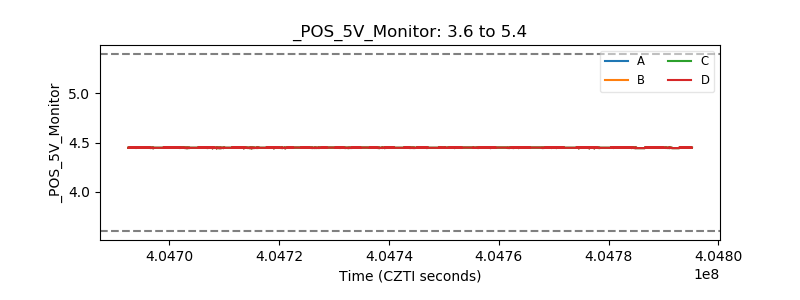 |
| _ROLL_ROT | 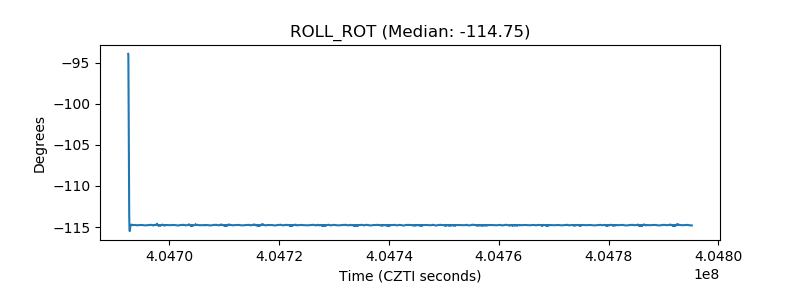 |
| _Roll_DEC | 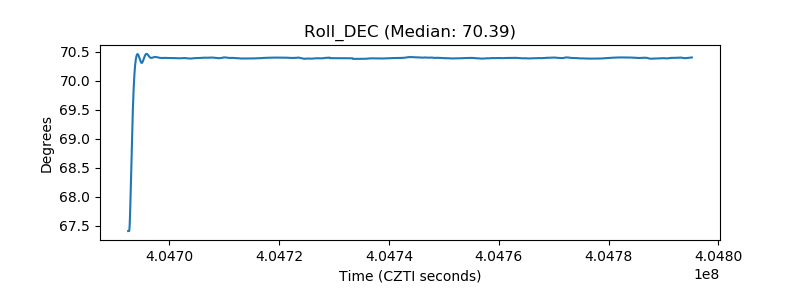 |
| _Roll_RA | 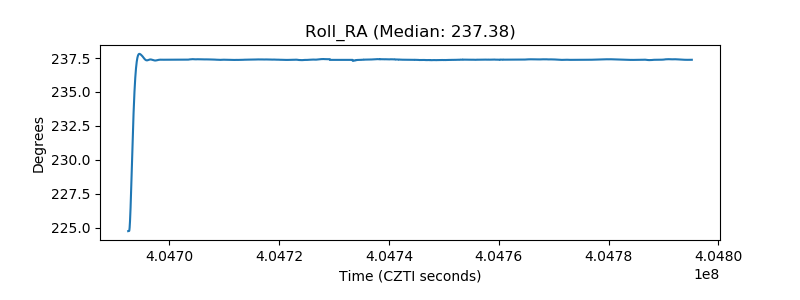 |
| Veto Counter | 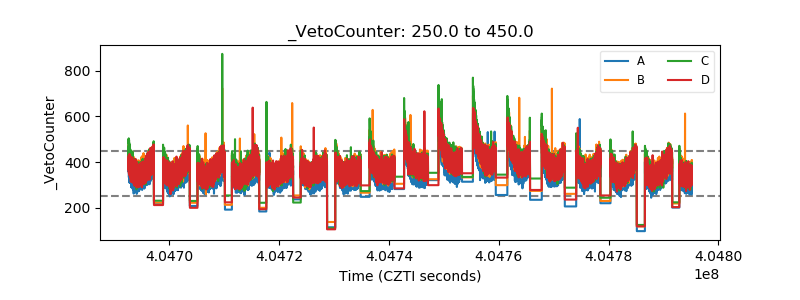 |