| Param | Original file | Final file |
|---|---|---|
| Filename | modeM0/AS1A10_094T24_9000005374cztM0_level2.fits | modeM0/AS1A10_094T24_9000005374cztM0_level2_quad_clean.evt |
| Size (bytes) | 1,633,924,800 | 2,421,345,600 |
| Size | 1.5 GB | 2.3 GB |
| Events in quadrant A | 9,894,270 | 16,409,121 |
| Events in quadrant B | 9,692,904 | 16,862,946 |
| Events in quadrant C | 9,914,224 | 16,259,348 |
| Events in quadrant D | 7,465,638 | 11,316,498 |
| Mode SS | |||
|---|---|---|---|
| Quadrant | BADHDUFLAG | Total packets | Discarded packets |
| A | 0 | 3744 | 0 |
| B | 0 | 3744 | 0 |
| C | 0 | 3744 | 0 |
| D | 0 | 3744 | 0 |
| Mode M0 | |||
|---|---|---|---|
| Quadrant | BADHDUFLAG | Total packets | Discarded packets |
| A | 0 | 417570 | 0 |
| B | 0 | 416286 | 0 |
| C | 0 | 379684 | 0 |
| D | 0 | 980898 | 0 |
| Mode M9 | |||
|---|---|---|---|
| Quadrant | BADHDUFLAG | Total packets | Discarded packets |
| A | 0 | 701 | 0 |
| B | 0 | 701 | 0 |
| C | 0 | 701 | 0 |
| D | 0 | 701 | 0 |
| Quadrant | Total seconds | Saturated seconds | Saturation percentage |
|---|---|---|---|
| A | 179907 | 2360 | 1.311789% |
| B | 183127 | 2197 | 1.199714% |
| C | 183127 | 584 | 0.318904% |
| D | 183127 | 49376 | 26.962709% |
Noise dominated data is calculated using 1-second bins in cleaned event files. If a bin has >2000 counts, and if more than 50% of those come from <1% of pixels, then it is considered to be noise-dominated and hence unusable.
| Quadrant | # 1 sec bins | Bins with >0 counts | Bins with >2000 counts | High rate bins dominated by noise | Noise dominated (total time) | Noise dominated (detector-on time) | Marked lightcurve |
|---|---|---|---|---|---|---|---|
| A | 253245 | 179882 | 0 | 0 | 0.00% | 0.00% |  |
| B | 253245 | 183038 | 0 | 0 | 0.00% | 0.00% |  |
| C | 253245 | 183114 | 0 | 0 | 0.00% | 0.00% |  |
| D | 253245 | 182916 | 0 | 0 | 0.00% | 0.00% | 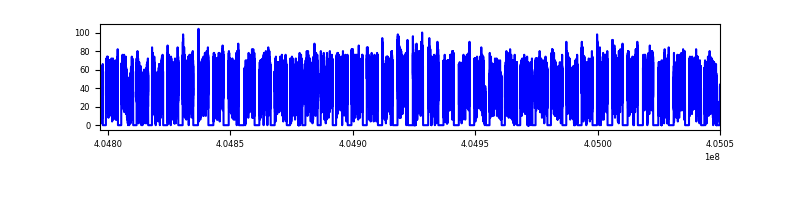 |
Top three noisy pixels from each quadrant. If the there are fewer than three noisy pixels in the level2.evt file, extra rows are filled as -1
| Pixel properties | Quadrant properties | ||||||
|---|---|---|---|---|---|---|---|
| Quadrant | DetID | PixID | Counts | Sigma | Mean | Median | Sigma |
| A | 0 | 29 | 8297 | 9.21 | 2591 | 2441 | 635.9 |
| A | 9 | 19 | 8138 | 8.96 | 2591 | 2441 | 635.9 |
| A | 7 | 110 | 8027 | 8.78 | 2591 | 2441 | 635.9 |
| B | 2 | 9 | 8338 | 11.85 | 2576 | 2465 | 495.6 |
| B | 3 | 80 | 7679 | 10.52 | 2576 | 2465 | 495.6 |
| B | 5 | 255 | 6768 | 8.68 | 2576 | 2465 | 495.6 |
| C | 1 | 81 | 8446 | 9.0 | 2629 | 2478 | 663.3 |
| C | 1 | 80 | 8019 | 8.35 | 2629 | 2478 | 663.3 |
| C | 3 | 187 | 6822 | 6.55 | 2629 | 2478 | 663.3 |
| D | 7 | 3 | 5492 | 6.26 | 2144 | 1960 | 564.3 |
| D | 4 | 160 | 5470 | 6.22 | 2144 | 1960 | 564.3 |
| D | 10 | 189 | 5349 | 6.01 | 2144 | 1960 | 564.3 |
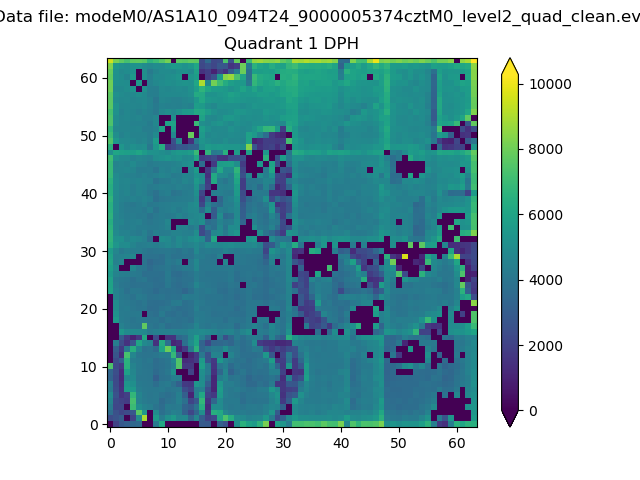
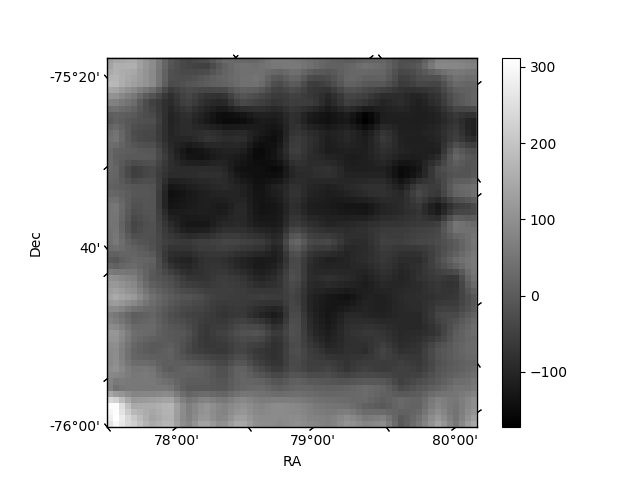
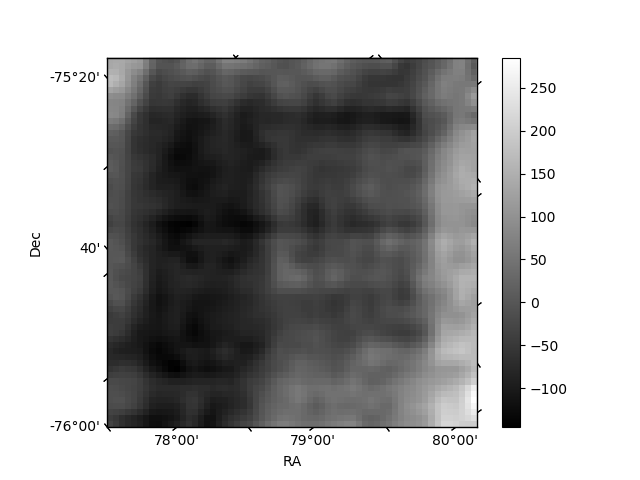
Histogram calculated using DETX and DETY for each event in the final _common_clean file
| Quadrant A | 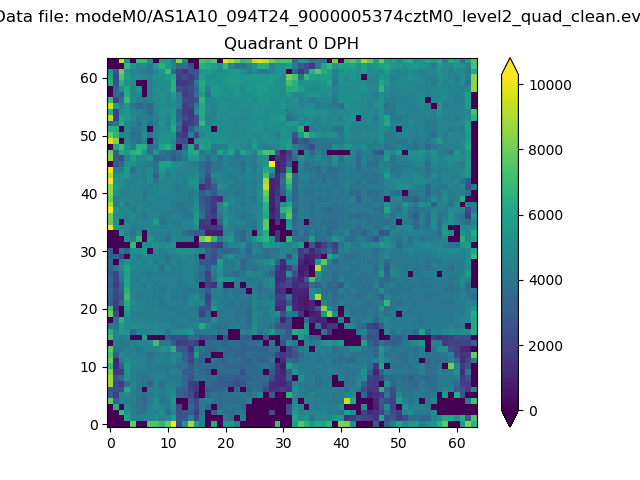 |
 |
Quadrant B |
|---|---|---|---|
| Quadrant D |  |
 |
Quadrant C |
| Plot type | Count rate plots | Images |
|---|---|---|
| Comparison with Poisson distribution Blue bars denote a histogram of data divided into 1 sec bins. Red curve is a Poisson curve with rate = median count rate of data. |
 |
 |
| Quadrant-wise count rates Data is divided into 100 sec bins |
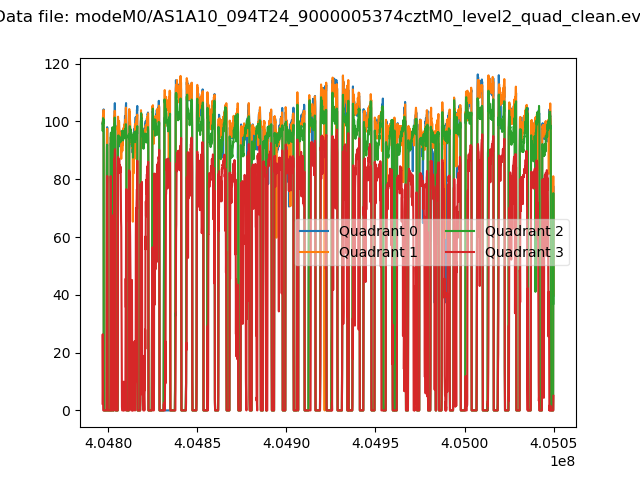 |
|
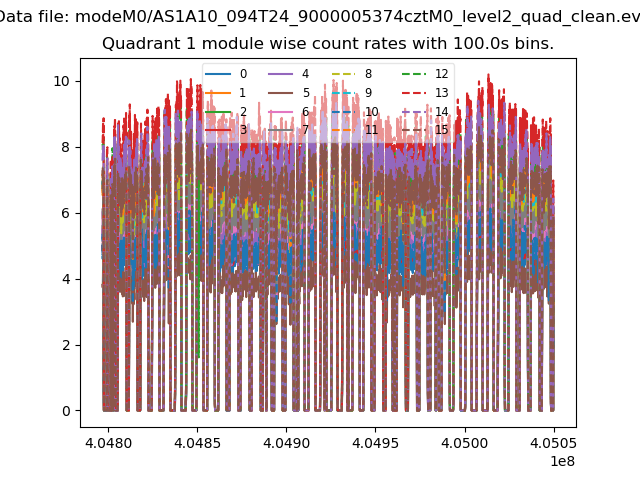
| Module-wise count rates for Quadrant A Data is divided into 100 sec bins |
 |
 |
| Module-wise count rates for Quadrant B Data is divided into 100 sec bins |
 |
 |
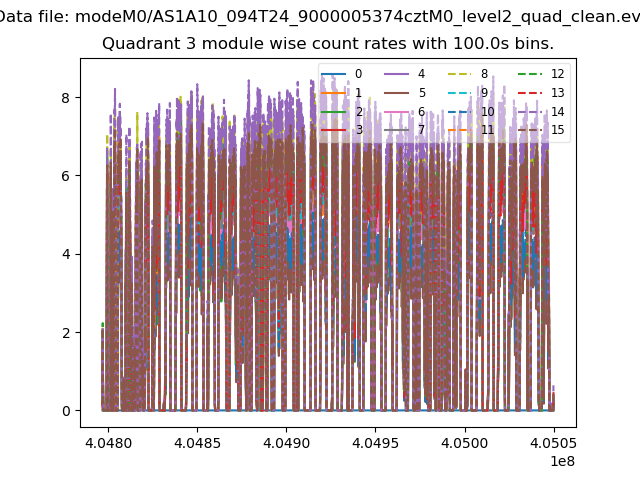
| Module-wise count rates for Quadrant C Data is divided into 100 sec bins |
 |
 |
| Module-wise count rates for Quadrant D Data is divided into 100 sec bins |
 |
 |
| Parameter | Plot |
|---|---|
| CZT HV Monitor | 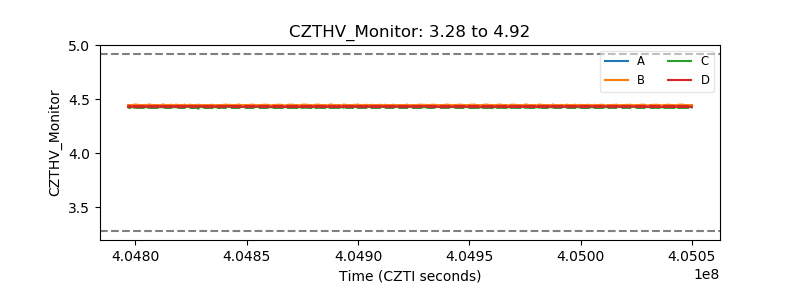 |
| D_VDD | 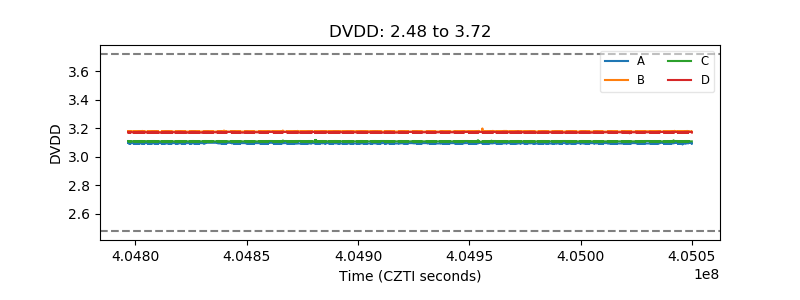 |
| Temperature 1 |  |
| Veto HV Monitor |  |
| Veto LLD |  |
| Alpha Counter | 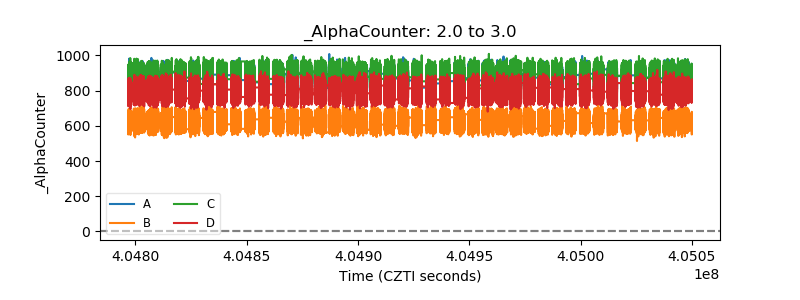 |
| _CPM_Rate |  |
| CZT Counter |  |
| +2.5 Volts monitor |  |
| +5 Volts monitor |  |
| _ROLL_ROT |  |
| _Roll_DEC |  |
| _Roll_RA | 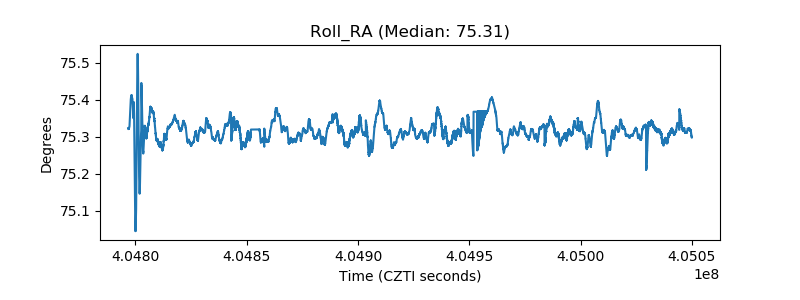 |
| Veto Counter |  |