| Param | Original file | Final file |
|---|---|---|
| Filename | modeM0/AS1A12_006T07_9000005376cztM0_level2.fits | modeM0/AS1A12_006T07_9000005376cztM0_level2_quad_clean.evt |
| Size (bytes) | 199,877,760 | 186,226,560 |
| Size | 190.6 MB | 177.6 MB |
| Events in quadrant A | 1,217,456 | 1,099,859 |
| Events in quadrant B | 1,160,206 | 1,101,990 |
| Events in quadrant C | 1,201,804 | 1,055,305 |
| Events in quadrant D | 906,874 | 817,717 |
| Mode M0 | |||
|---|---|---|---|
| Quadrant | BADHDUFLAG | Total packets | Discarded packets |
| A | 0 | 51906 | 0 |
| B | 0 | 53600 | 0 |
| C | 0 | 50471 | 0 |
| D | 0 | 122050 | 0 |
| Mode M9 | |||
|---|---|---|---|
| Quadrant | BADHDUFLAG | Total packets | Discarded packets |
| A | 0 | 59 | 0 |
| B | 0 | 59 | 0 |
| C | 0 | 59 | 0 |
| D | 0 | 59 | 0 |
| Mode SS | |||
|---|---|---|---|
| Quadrant | BADHDUFLAG | Total packets | Discarded packets |
| A | 0 | 462 | 0 |
| B | 0 | 462 | 0 |
| C | 0 | 462 | 0 |
| D | 0 | 462 | 0 |
| Quadrant | Total seconds | Saturated seconds | Saturation percentage |
|---|---|---|---|
| A | 22726 | 143 | 0.629235% |
| B | 22726 | 891 | 3.920620% |
| C | 22726 | 241 | 1.060459% |
| D | 22726 | 5405 | 23.783332% |
Noise dominated data is calculated using 1-second bins in cleaned event files. If a bin has >2000 counts, and if more than 50% of those come from <1% of pixels, then it is considered to be noise-dominated and hence unusable.
| Quadrant | # 1 sec bins | Bins with >0 counts | Bins with >2000 counts | High rate bins dominated by noise | Noise dominated (total time) | Noise dominated (detector-on time) | Marked lightcurve |
|---|---|---|---|---|---|---|---|
| A | 28607 | 22726 | 0 | 0 | 0.00% | 0.00% |  |
| B | 28607 | 22718 | 0 | 0 | 0.00% | 0.00% | 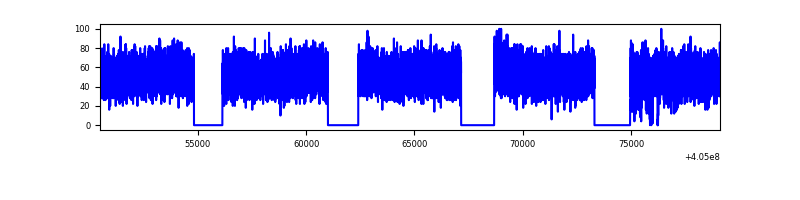 |
| C | 28607 | 22726 | 0 | 0 | 0.00% | 0.00% |  |
| D | 28607 | 22684 | 0 | 0 | 0.00% | 0.00% | 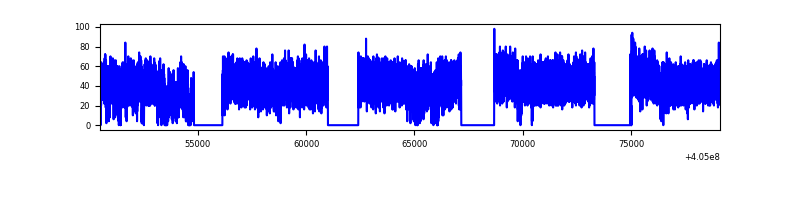 |
Top three noisy pixels from each quadrant. If the there are fewer than three noisy pixels in the level2.evt file, extra rows are filled as -1
| Pixel properties | Quadrant properties | ||||||
|---|---|---|---|---|---|---|---|
| Quadrant | DetID | PixID | Counts | Sigma | Mean | Median | Sigma |
| A | 9 | 19 | 1048 | 9.33 | 317 | 298 | 80.4 |
| A | 7 | 110 | 1013 | 8.9 | 317 | 298 | 80.4 |
| A | 0 | 29 | 990 | 8.61 | 317 | 298 | 80.4 |
| B | 2 | 9 | 1091 | 12.91 | 306 | 292 | 61.9 |
| B | 3 | 80 | 874 | 9.4 | 306 | 292 | 61.9 |
| B | 2 | 8 | 863 | 9.22 | 306 | 292 | 61.9 |
| C | 1 | 80 | 986 | 8.29 | 317 | 296 | 83.2 |
| C | 1 | 81 | 983 | 8.26 | 317 | 296 | 83.2 |
| C | 3 | 203 | 912 | 7.4 | 317 | 296 | 83.2 |
| D | 7 | 3 | 686 | 6.34 | 259 | 236 | 71.0 |
| D | 4 | 160 | 669 | 6.1 | 259 | 236 | 71.0 |
| D | 10 | 113 | 649 | 5.82 | 259 | 236 | 71.0 |
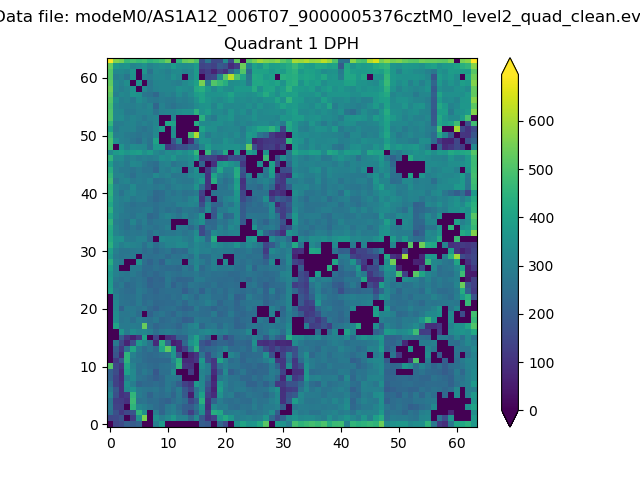
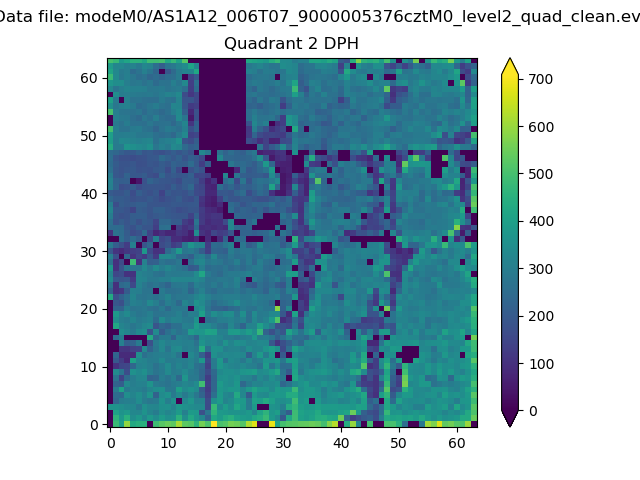
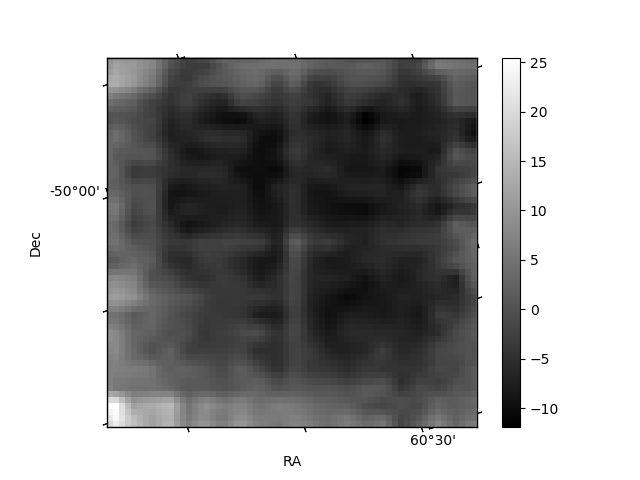
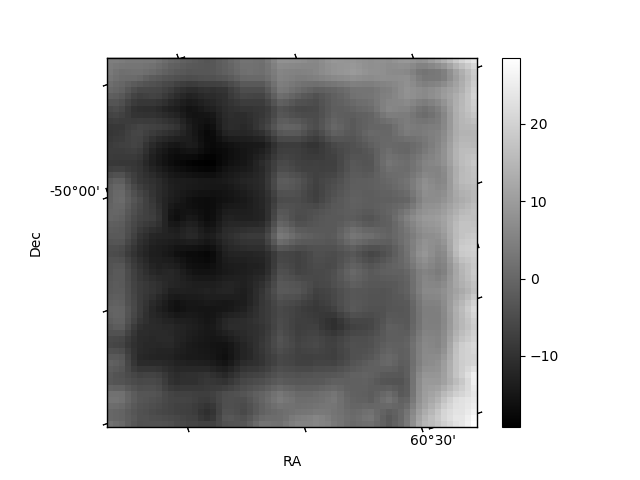
Histogram calculated using DETX and DETY for each event in the final _common_clean file
| Quadrant A |  |
 |
Quadrant B |
|---|---|---|---|
| Quadrant D |  |
 |
Quadrant C |
| Plot type | Count rate plots | Images |
|---|---|---|
| Comparison with Poisson distribution Blue bars denote a histogram of data divided into 1 sec bins. Red curve is a Poisson curve with rate = median count rate of data. |
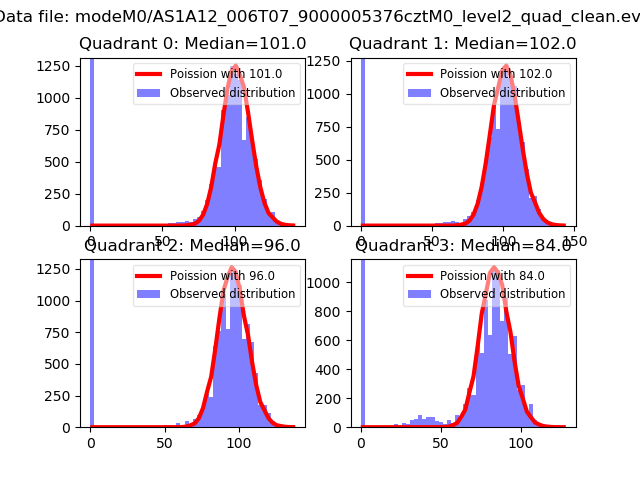 |
 |
| Quadrant-wise count rates Data is divided into 100 sec bins |
 |
|
| Module-wise count rates for Quadrant A Data is divided into 100 sec bins |
 |
 |
| Module-wise count rates for Quadrant B Data is divided into 100 sec bins |
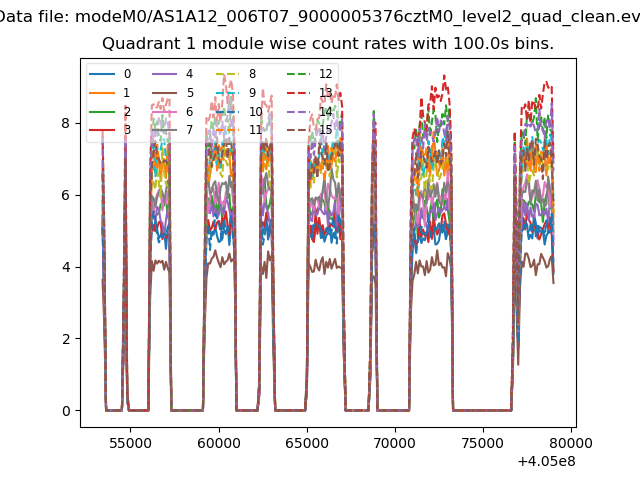 |
 |
| Module-wise count rates for Quadrant C Data is divided into 100 sec bins |
 |
 |
| Module-wise count rates for Quadrant D Data is divided into 100 sec bins |
 |
 |
| Parameter | Plot |
|---|---|
| CZT HV Monitor |  |
| D_VDD |  |
| Temperature 1 | 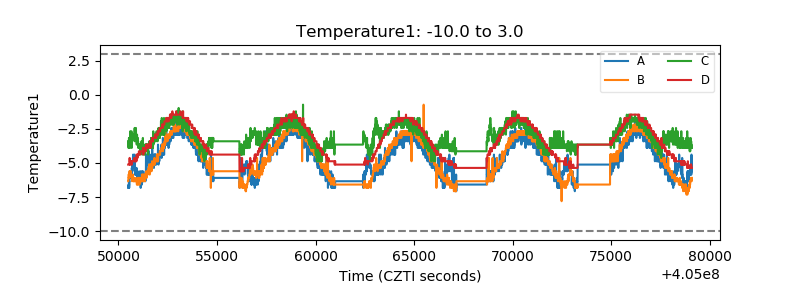 |
| Veto HV Monitor |  |
| Veto LLD |  |
| Alpha Counter |  |
| _CPM_Rate |  |
| CZT Counter |  |
| +2.5 Volts monitor |  |
| +5 Volts monitor | 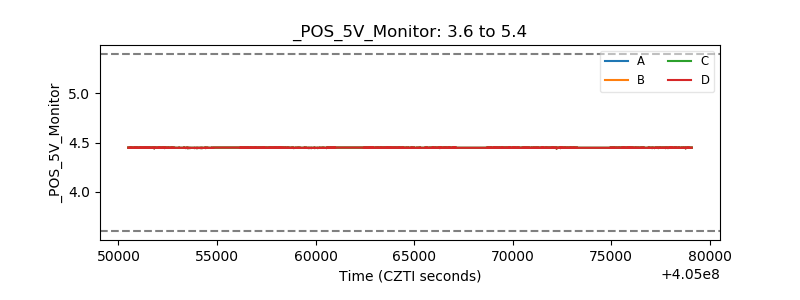 |
| _ROLL_ROT | 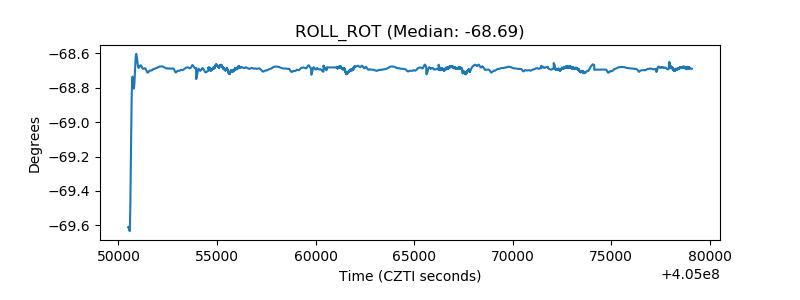 |
| _Roll_DEC |  |
| _Roll_RA |  |
| Veto Counter |  |